
Production Troubleshooting: From Alert to Root Cause
A practical Kitex RPC incident investigation, from P1/P2 alert triage through metrics, logs, traces, running code, and Kubernetes experiments on rollouts, autoscaling, draining, and load balancing.
Table of Contents
- Introduction: Two Alerts Arrive During an On-Call Shift
- 0. Reproducing the Incident
- 1. How I Think About Production Troubleshooting
- 2. Investigating the Incident, Starting With the Alert
- 3. Practice With Other Failure Modes
- 4. Appendix: Six Questions Worth Investigating
- 5. Conclusion
Introduction: Two Alerts Arrive During an On-Call Shift
Imagine that you are on call. Your current task is almost finished when an email arrives: [FIRING][P2][WARNING]. Kitex RPC requests in Zone A have started timing out.
Before you can open the dashboard, a second message appears: [FIRING][P1][CRITICAL]. The timeout ratio in the same zone has remained above a higher threshold, so the alert has escalated.
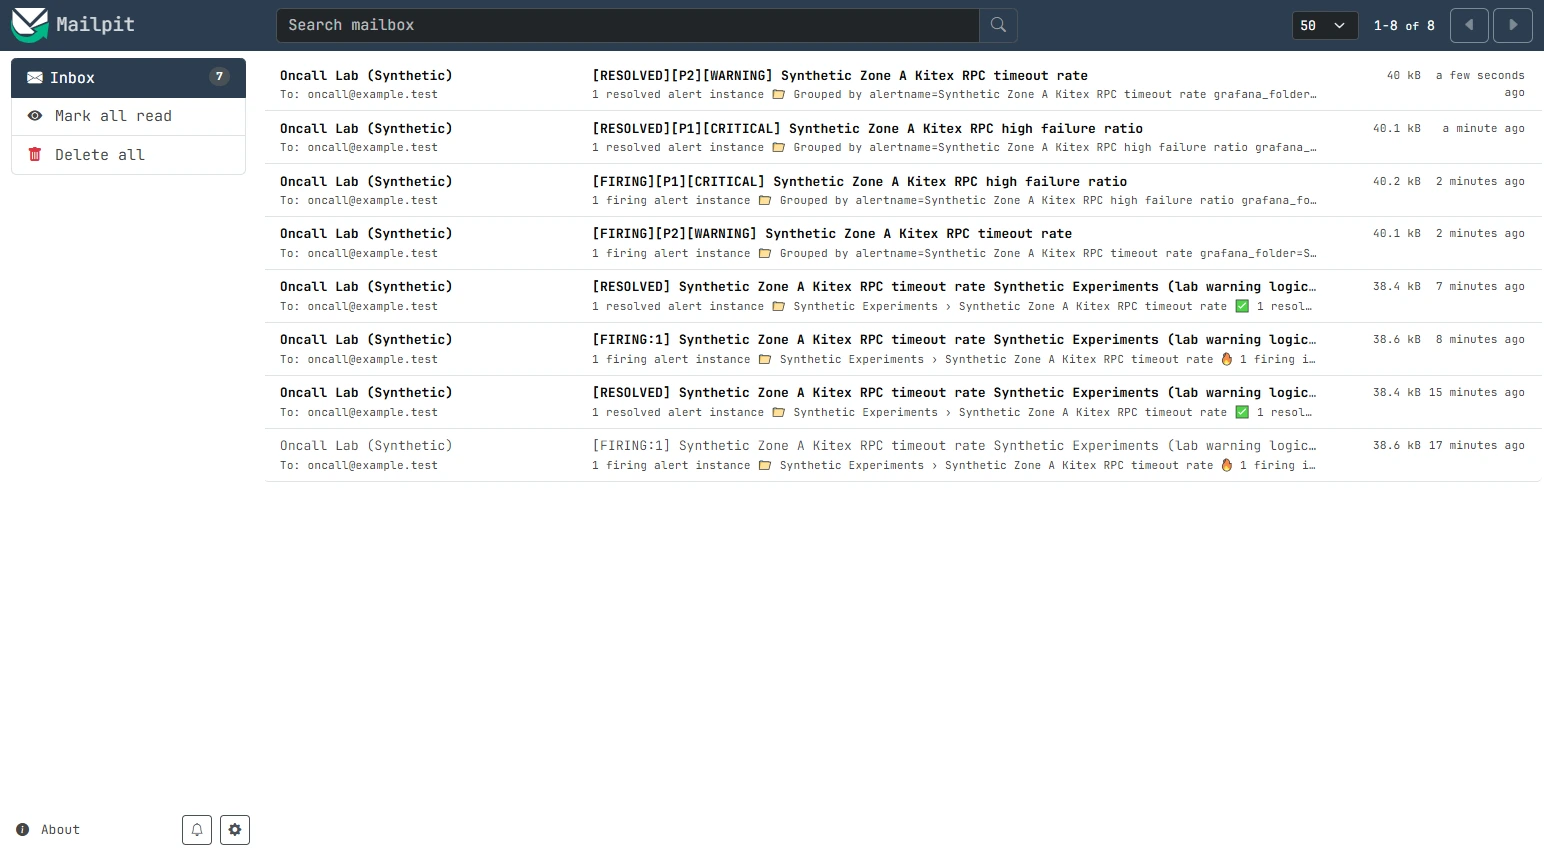
Now it is your problem to handle. You know that some RPCs are failing, but not how many requests are affected. You know the errors are concentrated in Zone A, but not whether one instance is responsible or the problem spans an entire call chain. More importantly, an RPC timeout tells you that the caller did not receive a result in time; it does not tell you where that time was spent.
Was there a deployment? Did traffic spike? Is the downstream handler slow, or is the connection failing?
Rather than guessing, start by deciding which metrics to inspect, how to narrow the scope, and what evidence is needed before drawing a conclusion.
0. Reproducing the Incident
We built a local environment that reproduces the RPC timeout described above. It consists of three logical zones, each containing two Gateway and Metadata pairs. The services communicate through actual Kitex/Thrift RPC calls.
The test has three phases: send healthy requests, introduce a 1,500 ms delay in the Metadata handler for some Zone A requests—longer than the Gateway’s 1,200 ms RPC timeout—and then remove the delay and observe recovery.
Prometheus collects metrics, Loki collects logs, Tempo stores traces, and Grafana evaluates P1/P2 alert rules. Those notifications go to a local Mailpit inbox:
Load Generator (synthetic traffic)
    |
    +-- Zone A: Gateway A1/A2 --> Kitex Metadata A1/A2
    +-- Zone B: Gateway B1/B2 --> Kitex Metadata B1/B2
    +-- Zone C: Gateway C1/C2 --> Kitex Metadata C1/C2
                  |
                  +-- Kitex / application metrics --> Prometheus
                  +-- JSON logs ------------------> Promtail --> Loki
                  +-- OpenTelemetry traces -------> Tempo
                                                       |
                  Grafana Dashboard / Explore <--------+
                  Grafana Alerting --> local SMTP --> Mailpit
All three zones are Docker logical fault domains on one physical host, not separate data centers. Mailpit receives mail locally. Later, the rollout, autoscaling, and draining exercises use a separate Kind cluster on the same host.
Reproduce the Alerts Yourself
Code: oncall-lab. The complete setup, configuration, and cleanup instructions are in the English README, with a Chinese version.
You need Git, Docker Compose, Bash, Python 3, and curl, with Docker running. On Windows, use WSL2 with Docker Desktop integration. The host does not need Go for this experiment.
git clone https://github.com/ThinkerQAQ/oncall-lab.git
cd oncall-lab
cp .env.example .env

# Edit .env and set your own GRAFANA_ADMIN_PASSWORD.
bash scripts/scenarios/replay-alert-notification.sh
The script builds and starts the services, runs baseline → Zone A timeout injection → recovery, and checks actual request results and the P1/P2 firing and recovery emails.
When it finishes, open Mailpit to inspect the same alerts, then open Grafana for request rates, timeout metrics, logs, and traces. Sign in to Grafana Explore as demo using the password from .env.
Request counts may differ slightly from run to run. Check that the failures are concentrated in Zone A, the system recovers, and both alert levels are actually delivered.
1. How I Think About Production Troubleshooting
Before starting the investigation, I want to explain how I approach production issues.
Production systems produce all kinds of anomalies: lower success rates, timeouts, instance restarts, and resource spikes. Not every anomaly is an incident, but an unattended anomaly can turn into a reliability problem.
Someone must take responsibility for responding and moving the issue forward. That person does not have to solve every problem alone. The on-call owner acts as the incident’s point of contact: assess impact, find the appropriate owners, coordinate mitigation, verify recovery, and preserve what the team learned.
One common mistake is jumping straight to a particular file or assuming that a familiar error message identifies the root cause. A better approach is to understand what the alert measures, then eliminate explanations that do not fit the evidence.
I use seven steps:
- Prioritize: decide how urgently the issue needs attention.
- Acknowledge: establish that somebody is taking ownership.
- Understand the context: when, where, what happened, and what normal looks like.
- Analyze: inspect changes, overall metrics, detailed dimensions, logs/traces, and code.
- Conclude: separate observed symptoms, failure mechanisms, and unconfirmed hypotheses.
- Resolve: mitigate, coordinate with owners, and verify recovery.
- Document: preserve a reasoning trail that can be reused.
The sequence is a guide, not a rigid checklist. If a recent deployment is clearly causing a major outage, rolling back may be the first priority. A brief, low-impact blip may only need verification and a note.
2. Investigating the Incident, Starting With the Alert
2.1 Set Priorities
Look at the two messages. P2/Warning indicates RPC timeouts in Zone A. P1/Critical means the timeout ratio has exceeded a higher threshold for a sustained period. Before opening the logs, determine which one needs immediate attention.
Teams often distinguish three dimensions:
| Dimension | Example ordering | What it answers |
|---|---|---|
| Incident priority | P0 > P1 > P2 | How much business impact is there, and how quickly must we respond? |
| Notification channel | Phone > instant message > email | How quickly should somebody notice it? |
| Alert severity | Critical > Warning | How far has a monitored metric crossed its threshold? |
These are not the same enumeration. Critical describes the alert rule’s severity; P1 is the incident’s response priority. A severity=critical label is not proof of a P0 incident, and notification delivery method does not determine business impact.
Two rules are configured:
- P2 / Warning: Zone A Kitex timeout QPS exceeds
0.05/s. - P1 / Critical: Zone A’s timeout ratio stays above 25% for 20 seconds.
P0 would require additional evidence, such as widespread unavailability of a core service and the number of users affected. These are lab thresholds; production thresholds should follow SLOs and historical baselines.
With both alerts active, assess P1 first: how many requests are affected, how long the failure has lasted, and whether other critical paths are degraded. Do not simply handle messages in arrival order.
2.2 Acknowledge and Take Ownership
Once a serious alert is detected, establish that somebody is responding. Many teams provide an ACK or claim action in their incident system; others use the on-call channel to say that the investigation has begun.
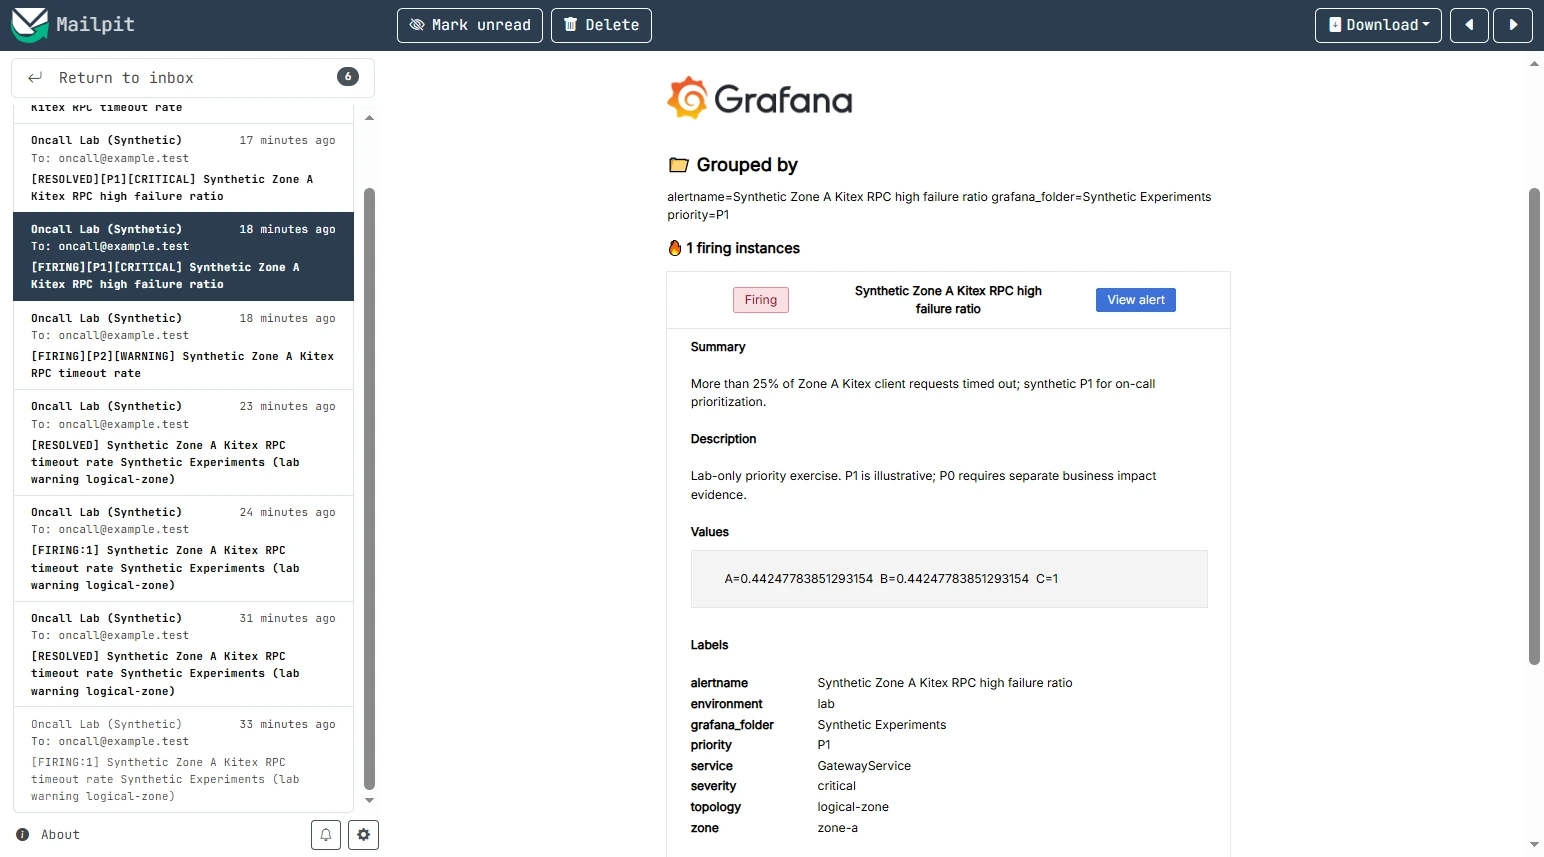
Reading an email is not the same as acknowledging an incident. Claim it in the incident platform, or explicitly confirm ownership in the team’s communication channel.
Capture the essentials:
- When the alert fired versus when the metric began changing.
- Service, method, environment, and priority.
- Whether the condition is ongoing or already resolved.
- Current owner, communication channel, and next update.
Then investigate the time, scope, and origin of the failure rather than immediately guessing whether it belongs to the client, server, or network.
2.3 Understand the Context
At minimum, answer two questions:
- When, where, and what went wrong?
- What does normal behavior look like?
The load generator sent 2,675 requests in three phases:
| Phase | Requests | Failures | Observation |
|---|---|---|---|
| Baseline (12 s) | 299 | 0 | All three zones healthy |
| Incident (60 s) | 1,500 | 370 | Timeouts only in Zone A |
| Recovery (35 s) | 876 | 0 | All three zones healthy again |
| Total | 2,675 | 370 | All requests recorded in experiment logs |
These counts come from the load generator’s actual outcomes. Do not mix them with Prometheus counter totals collected over different windows. Load-generation timestamps and scrape timestamps do not coincide exactly, so a short-window rate() is not necessarily identical to requests divided by the entire phase duration.
During the incident, Zone A handled 820 calls with 370 failures, or roughly 45.1%. Zone B handled 408 calls and Zone C handled 272, with zero failures in either zone. Across all three zones, the incident-window failure ratio was 370/1500 ≈ 24.7%, not 45.1%.
Two denominators matter:
- Zone A failure ratio: failed A requests divided by all A requests.
- Overall failure ratio: failures divided by requests across A/B/C.
The P1 alert uses the Zone A timeout ratio, so it can fire even when the overall failure ratio remains below 25%.
2.3.1 What Does the Metric Measure, and Who Reports It?
An “RPC timeout” alert can come from several observation points:
| Location | Example metrics | What they tell you |
|---|---|---|
| Caller | Client RPC count, success, timeout, latency | What the caller experienced |
| Gateway / proxy | Routing, connection errors, forwarding latency, status codes | What the proxy observed |
| Callee framework | Server request count, method latency, server errors | What the server received and processed |
| Application handler | Business error codes, validation failures | Depends on instrumentation placement |
| Infrastructure | CPU, memory, Pod restarts, node networking | Resource/runtime state, not RPC outcome |
| Dependencies (Redis, MQ, DB) | Throughput, delay, connections, queue depth | Only the corresponding dependency’s view |
This lab uses both Kitex’s Prometheus instrumentation and explicit application metrics:
kitex_client_throughput: emitted by the Kitex client instrumentation.rpc_client_requests_total: the Gateway’s actual call results, includingresultanderror_code.rpc_server_requests_total: the Metadata handler’s actual result counter.process_cpu_seconds_totalandprocess_resident_memory_bytes: real process CPU/RSS metrics.
A client-side timeout is not necessarily a server-side failure. The caller may stop waiting while the server handler continues running. Correlated logs and spans will show the difference.
2.3.2 Check Alert History
Grafana’s alert history shows:
Normal --> Alerting --> Normal
                  |
            Mailpit FIRING
            Mailpit RESOLVED
Grafana stores state transitions in Loki State History, while Mailpit receives the corresponding firing and resolved emails.
For historical alerts, look for repetition, duration, and correlations with deployments or traffic peaks. Compare QPS, error ratio, and latency with the same hour yesterday or the previous week. A recurring alert is not automatically harmless.
2.4 Analyze the Incident
At this point we know:
- The incident window lasted 60 seconds.
- The call path is
GatewayService → MetadataService.GetMetadata. - Kitex RPC calls timed out on the client side in Zone A; B/C did not fail.
- Both P2/Warning and P1/Critical fired and later resolved.
Start with recent changes, then move through metrics to individual requests.
2.4.1 Inspect Recent Changes
Check changes first, regardless of which symptom you are investigating.
Start with the caller and then the callee:
- Was Gateway recently deployed, or were its routing and timeout settings changed?
- Was Metadata deployed, scaled, restarted, or moved to new instances?
- Did dependencies, configuration, or service discovery change?
- Do the change timestamps align with the alert window?
A useful change record includes time, target, operation, old/new version, and outcome.
Docker exposes the real container creation, image ID, and start time:
docker inspect oncall-lab-gateway-zone-a1-1 \
  --format '{{.Created}} {{.Image}} {{.State.StartedAt}}'

docker inspect oncall-lab-metadata-zone-a1-1 \
  --format '{{.Created}} {{.Image}} {{.State.StartedAt}}'

python3 scripts/capture_changes.py
Recreating gateway-zone-c2 changed its StartedAt while the Image ID remained the same. A recently started instance is not necessarily a newly released version. Also check image digest, Git commit, effective configuration, and Deployment revision.
Compare the restart time against the incident before attributing causality. If a live deployment is expanding the impact of a serious incident, consider pausing or rolling it back while preserving change evidence. Appendix 4.1 looks at how rollouts can introduce errors.
2.4.2 Inspect the Overall Dashboard: Caller First, Then Callee
After checking changes, inspect the broader monitoring picture. Start with a longer time window, then zoom into the minutes around the alert. Where sufficient history exists, compare with the previous day’s baseline.
Gateway (caller):
- Did request QPS suddenly increase?
- Did success ratio drop, and for how long?
- Did P95/P99 latency change at the same time?
- Did process CPU or RSS spike?
- Did other methods fail simultaneously? An unrelated spike is not supporting evidence.
Metadata (callee):
- Did the server receive the calls?
- Did its request QPS move with the caller?
- How long did its handler run?
- Were all instances affected or only a subset?
- Did resources saturate, Pods restart, or health checks fail?
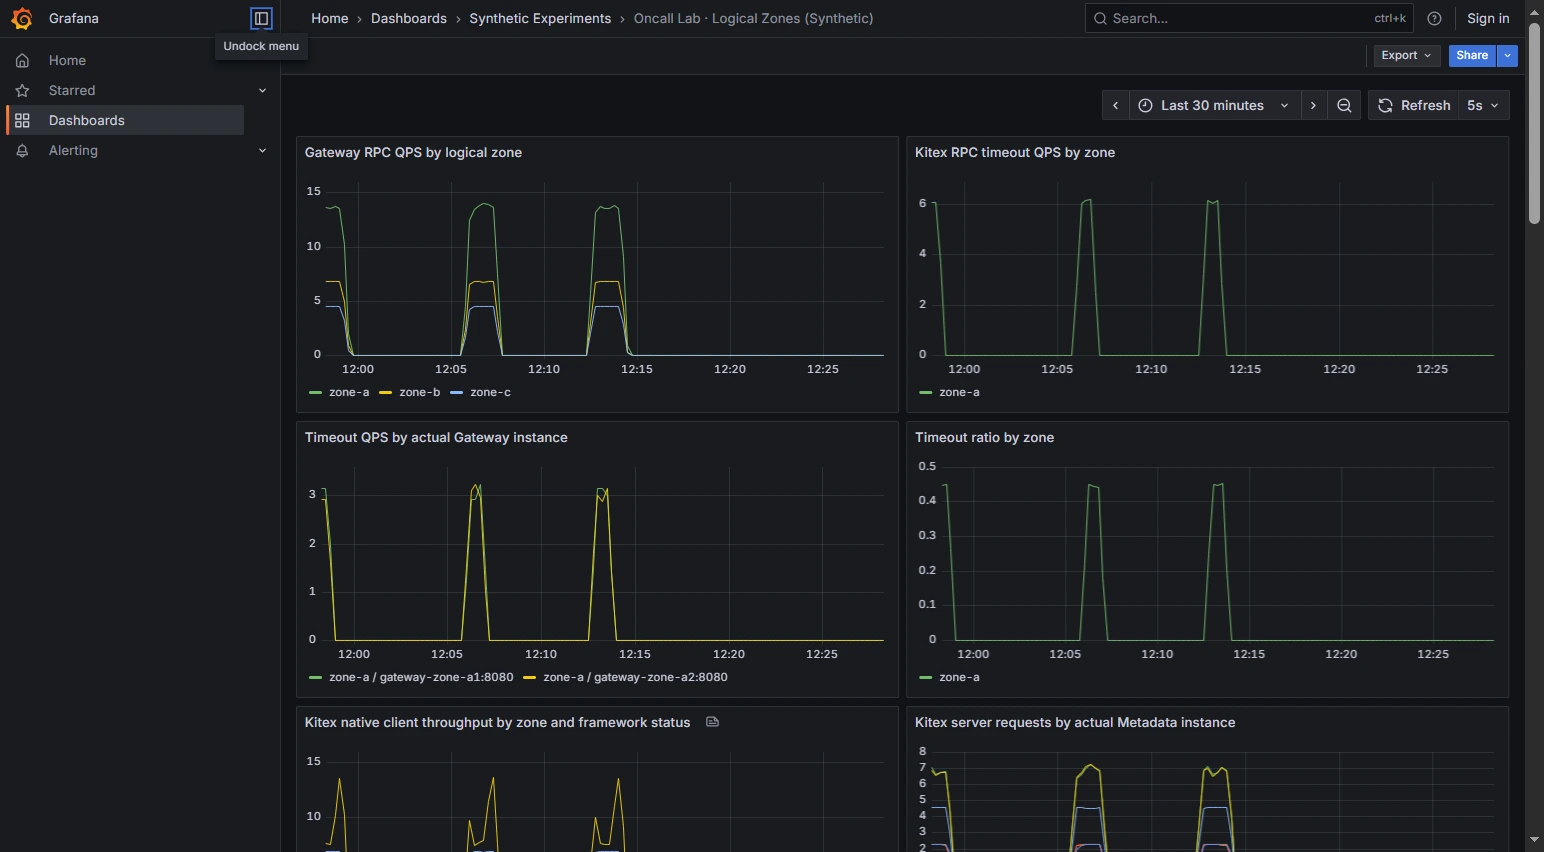
Grafana also shows process CPU and RSS. Low CPU does not rule out connection pool exhaustion, lock contention, I/O waits, or a hotspot affecting only one instance.
Total QPS did not show a matching traffic spike across the three phases. Next, check whether timeouts are concentrated in a particular zone or instance.
2.4.3 Drill Into the Metrics: Time, Environment, Zone, Instance, and Error Code
The overall dashboard confirms client-side timeouts. Now we need to identify which requests failed and what they have in common.
Dashboards show general trends. To filter and aggregate the individual dimensions, open Grafana Explore, select Prometheus, and use PromQL.
Step 1: Choose the time window and compare with healthy traffic.
Query client-side failure QPS:
sum(
  rate(rpc_client_requests_total{
    env="lab",
    result!="success",
    zone=~"zone-.*"
  }[30s])
)
Compare the baseline, incident, and recovery phases with total request QPS:
sum(rate(rpc_client_requests_total{env="lab",zone=~"zone-.*"}[30s]))With historical data, Grafana Time shift or PromQL offset 1d can compare the same time yesterday.
Distinguish rate(counter[30s]) from the raw counter. Counters reset when an instance restarts; cumulative values from different instances should not be compared naively across windows. Use rate() for most QPS charts and increase() when calculating increments over a selected interval.
Step 2: Filter by environment.
PromQL label selectors filter series; sum by (...) groups them:
sum by (env) (
  rate(rpc_client_requests_total{result="timeout"}[30s])
)
This lab only has env="lab". In a production system, compare environments such as production and staging to determine whether the issue is environment-specific.
Step 3: Group by Zone.
sum by (zone) (
  rate(rpc_client_requests_total{
    env="lab",
    result="timeout",
    zone=~"zone-.*"
  }[30s])
)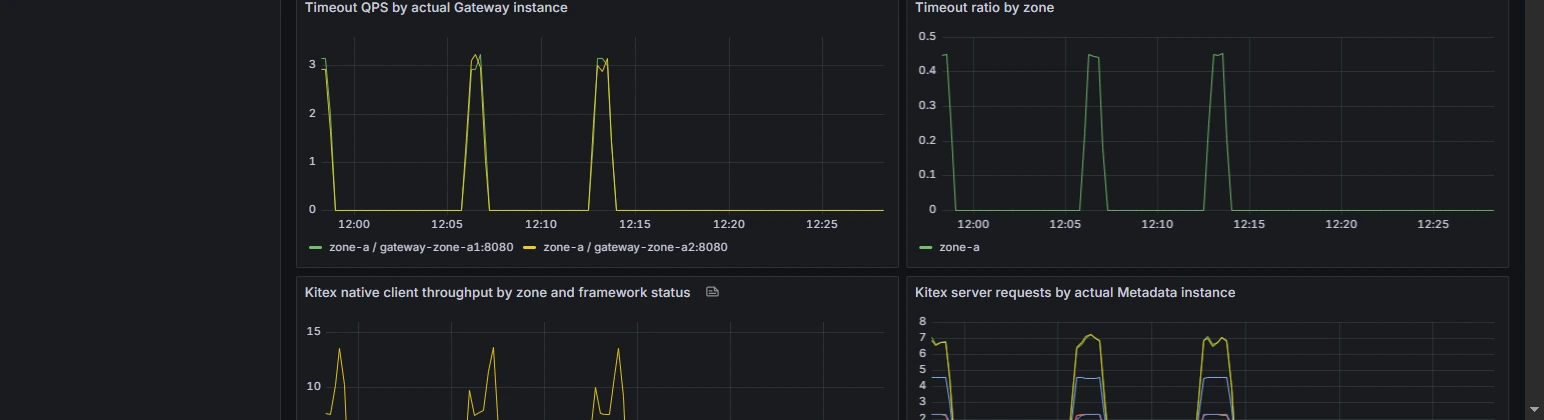
The result is clear: timeouts are concentrated in Zone A, while Zones B and C have no failed calls.
The zone label comes from Prometheus scrape configuration and corresponds to the Docker logical zone.
In a real deployment, a zone-specific alert should lead you to check whether other services in the zone are failing, along with node health, networking, DNS, load balancing, and discovery. One service failing in Zone A does not prove that the whole availability zone has failed.
Step 4: Could this be a single-instance problem?
Group by the actual client instance:
sum by (zone, instance) (
  rate(rpc_client_requests_total{
    zone="zone-a",
    result="timeout"
  }[30s])
)
Or count the increments during the incident:
sum by (instance) (
  increase(rpc_client_requests_total{
    zone="zone-a",
    result="timeout"
  }[1m])
)
Here, instance identifies the Gateway client instance scraped by Prometheus, not the downstream Metadata server IP. Two instance series do not automatically mean two server instances.
Zone A has two independent RPC paths:
gateway-zone-a1  --Kitex/Thrift-->  metadata-zone-a1
gateway-zone-a2  --Kitex/Thrift-->  metadata-zone-a2
The load generator recorded:
| Gateway instance | Requests | Failures | Failure ratio |
|---|---|---|---|
gateway-zone-a1 |
409 | 184 | ~45.0% |
gateway-zone-a2 |
411 | 186 | ~45.3% |
| Zone A total | 820 | 370 | ~45.1% |
Both Gateways have approximately 45% timeouts. This is not a failure isolated to one Gateway process. Next, compare the paired Metadata server metrics.
sum by (zone, instance) (
  rate(rpc_server_requests_total{zone="zone-a"}[30s])
)
The client’s failure count and the server handler’s “success” count can differ: the caller can hit its deadline while the server completes its work. We will inspect the same request in Tempo.
If failures occur on only one instance, compare its traffic, latency, CPU/RSS, running version, and dependencies before removing it from rotation. Preserve process state when an investigation requires it. See appendices 4.3 and 4.6.
Step 5: Explain the Zone-level QPS difference.
Zone A receives more requests. Could its higher absolute number of errors simply reflect more traffic? Start with total QPS, not failure QPS:
sum by (zone) (
  rate(rpc_client_requests_total{zone=~"zone-.*"}[30s])
)
Then calculate the failure ratio per zone:
sum by (zone) (
  rate(rpc_client_requests_total{result!="success",zone=~"zone-.*"}[30s])
)
/
clamp_min(
  sum by (zone) (
    rate(rpc_client_requests_total{zone=~"zone-.*"}[30s])
  ),
  0.000001
)
The load generator uses these explicit routing weights:
Zone A: Gateway A1 weight 3, A2 weight 3 => zone weight 6
Zone B: Gateway B1 weight 2, B2 weight 1 => zone weight 3
Zone C: Gateway C1 weight 1, C2 weight 1 => zone weight 2

Total weight: 11
Expected shares: A 6/11, B 3/11, C 2/11
The observed incident counts, 820 / 408 / 272, are consistent with these weights.
Higher total traffic in Zone A is expected from routing configuration; it is not itself proof of a network fault. But routing weights cannot explain why only A has failed calls: B and C also receive requests, yet both have a 0% failure ratio.
Each zone has two Metadata processes, with one Gateway statically paired to one Metadata process. This traffic split therefore comes from the entry weights, not automatic service discovery balancing. Appendices 4.4 and 4.5 examine routing and per-instance distribution.
Step 6: Group by error code.
After narrowing the affected scope, inspect failure types using the Gateway’s error_code label:
sum by (zone, error_code) (
  rate(rpc_client_requests_total{
    zone=~"zone-.*",
    result!="success"
  }[30s])
)
The main incident uses rpc_timeout. Compare it with two additional failure modes:
| Trigger | Gateway result | Evidence |
|---|---|---|
| Metadata handler delays 1,500 ms | HTTP 504 | Kitex RPC timeout; error_code=rpc_timeout |
Metadata returns Kitex BizStatusError(2101) |
HTTP 502 | Actual business-status error; error_code=biz_2101 |
| One Metadata container stops | Potentially HTTP 504 | Kitex connection/lookup errors; retries may consume the RPC deadline |
2101 is a synthetic Metadata business code used to distinguish an application error from an RPC timeout.
HTTP 504 only means the caller did not complete within its time budget. DNS resolution, establishing a connection, retries, handler execution, and waiting for a reply can all consume that time. The status code alone cannot locate the delay.
Next, find one failed request in the logs and follow its trace.
2.4.4 Logs: Error Code → Request ID → Trace → Timeout Budget
Step 1: Confirm that logs are available.
Gateway and Metadata write JSON logs to a shared directory. Promtail ships them to Loki, and a trace_id can link both sides of the call.
In Grafana Explore, select Loki and query the timeout logs:
{job="oncall-lab", result="timeout", instance="gateway-zone-a1"}Or the synthetic application error:
{job="oncall-lab", error_code="biz_2101"}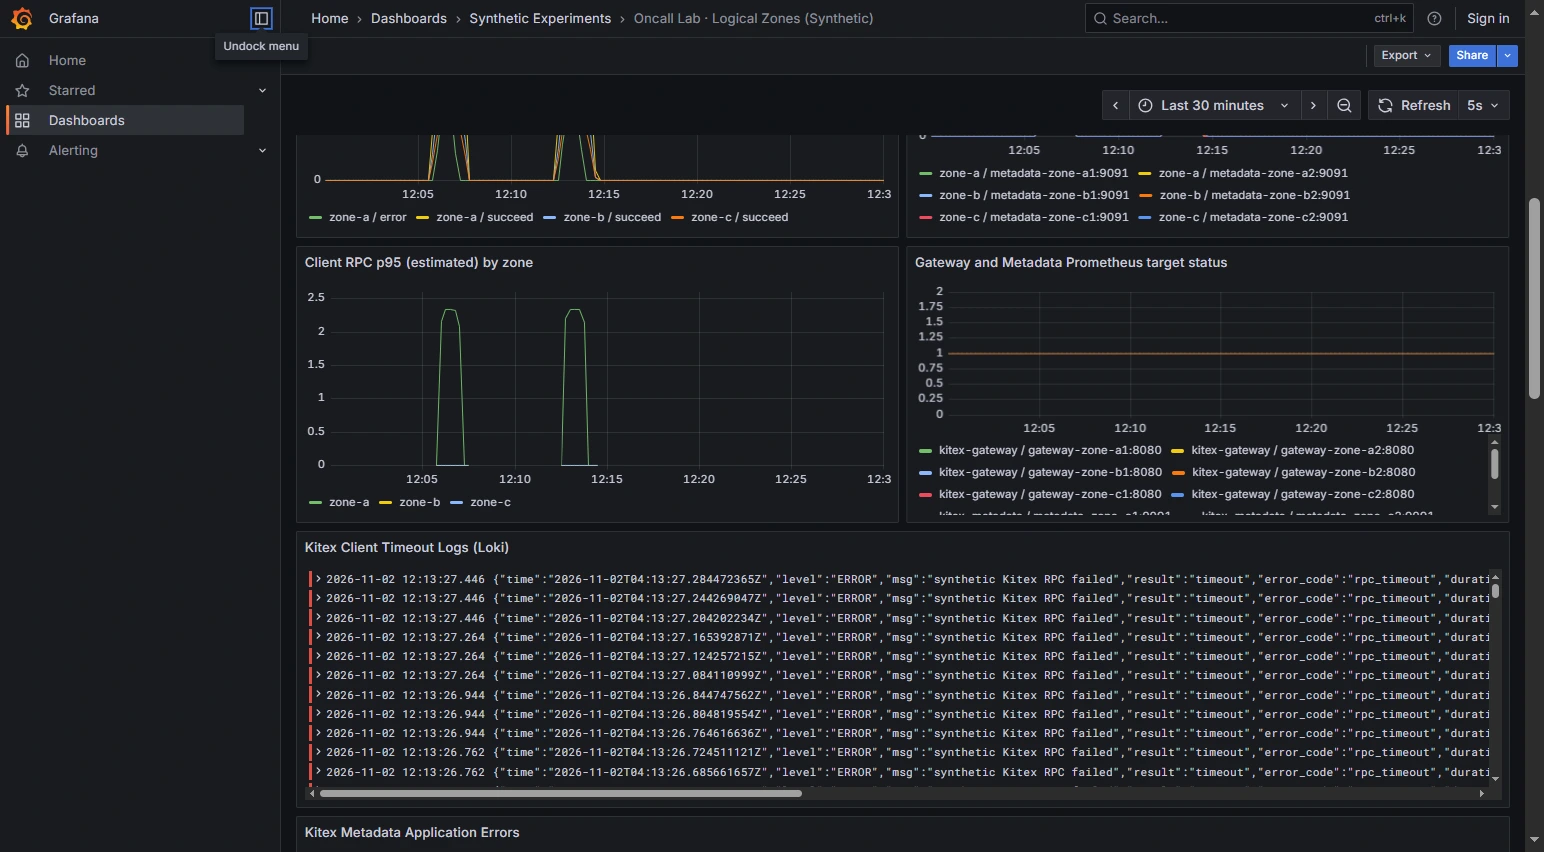
If a query returns nothing, check the time range, log shipping status, and retention period before deciding that the request never reached the instance.
Step 2: Pick one failure and locate its origin.
A request enters Gateway, which calls Metadata. The client has a 1,200 ms budget; Metadata was instructed to wait 1,500 ms.
A Gateway JSON log contains these fields:
{
  "msg": "synthetic Kitex RPC failed",
  "result": "timeout",
  "error_code": "rpc_timeout",
  "trace_id": "<32-character trace ID from the actual run>",
  "zone": "zone-a",
  "instance": "gateway-zone-a1"
}
The JSON above shows the relevant fields. Copy a real trace_id from Loki for the next query.
Step 3: Join caller and callee by Trace ID.
Filter on the copied ID:
{job="oncall-lab"} |= "paste_the_actual_trace_id_here"Then open Tempo. One validated timeout trace contains three spans:
GatewayService
└── HTTP GET /metadata                   ~1201 ms
    └── Kitex Client GetMetadata         ~1201 ms
        └── MetadataService GetMetadata  ~1501 ms
Check the trace and parent-child span relationships to make sure these observations belong to the same request.
This trace shows:
- The client stops waiting at about 1,200 ms and reports an RPC timeout.
- The server handler runs for roughly 1,500 ms and records its completion.
- Writing the response back can fail because the caller has already closed or abandoned the request.
The client can report failure while the Metadata handler reports success. They observe different lifecycle boundaries, so their counters are not necessarily inconsistent.
Step 4: Distinguish connection timeout from RPC timeout.
The actual Go client configuration is:
client.WithRPCTimeout(1200 * time.Millisecond),
client.WithConnectTimeout(200 * time.Millisecond),
These settings mean different things:
ConnectTimeout=200mslimits an individual connection-establishment attempt.RPCTimeout=1200mslimits the complete Kitex RPC budget.
Retries and connection acquisition can also consume that overall budget. Inspect Kitex’s actual errors to distinguish failed connections, request deadlines, and application errors.
In a separate exercise that stops a Metadata container, we observed lookup and connection-acquisition errors. The Gateway could still return HTTP 504 after retries consumed its RPC budget. One HTTP status may conceal several lower-level failure mechanisms.
Step 5: Determine where the time went.
If the RPC framework exposes fine-grained events, examine:
Request starts
  -> Acquire or establish connection
  -> Encode and write request
  -> Wait for response
  -> Read and decode response
  -> Complete business handling
The current traces cover client and server spans. To split socket reads and writes further, use more detailed framework events or packet capture.
A long client span can reflect server execution, queueing, connection waits, or network delays. A long client read wait alone does not prove a slow network. Here, the server’s 1,500 ms delay and its span identify the controlled handler delay as the main contributor. For suspected retransmissions or connection problems, inspect TCP RTTs, handshakes, and retransmission behavior with tcpdump or Wireshark.
2.4.5 Inspect Code: Match Logs to the Running Version
The metrics and traces now tell us:
- Zone A has failures on both Gateway client instances.
- Callers receive a Kitex timeout.
- Metadata handler time exceeds the caller’s budget.
- The Metadata server can finish after Gateway has stopped waiting.
Do not assume that the latest local checkout is the code running in production. Identify the exact deployed build:
Running container / Pod
    ↓ Image ID / Digest
Built image version and source commit
    ↓
Repository, branch, Git commit
    ↓
Logger / tracer call sites
    ↓
Effective RPC timeout settings and handler logic
Compare image ID, startup time, and effective configuration. Then locate the corresponding build and commit. Otherwise, reading a newer revision can lead you to the wrong explanation.
| Component | Repository location | What to inspect |
|---|---|---|
| RPC client | cmd/gateway/main.go |
Connection and RPC deadlines, error classification, logging |
| RPC server | cmd/metadata/main.go |
1,500 ms delay, business error, handler result |
| Load generator | cmd/loadgen/zone.go |
Zone selection and delay injection in Zone A |
| Tracing | Gateway/Metadata OpenTelemetry suites | Parent-child spans and context propagation |
| Metrics | Kitex Prometheus tracer + app counters | Client/server measurement boundaries |
The controlled delay is conceptually implemented as:
select {
case <-time.After(time.Duration(delayMs) * time.Millisecond):
    // Deliberate server-side delay
case <-ctx.Done():
    // Return early if the request context is canceled
}
Gateway maps kerrors.IsTimeoutError(err) or context.DeadlineExceeded to rpc_timeout, while a Kitex BizStatusError exposes biz_2101. Compare the running code and effective configuration with the observed logs. If they disagree, revisit image version and deployment records.
2.5 Form a Conclusion
Separate the symptom, direct failure mechanism, and trigger.
Observed symptoms
- The run included 2,675 requests, with 1,500 in the incident window and 370 failures.
- All failures occurred in Zone A; its two Gateway instances reported 184 and 186 failures.
- P2/Warning and P1/Critical both fired, delivered email, and later resolved.
- The Gateway returned Kitex RPC timeout / HTTP 504.
Verified mechanism
Gateway’s RPC budget was 1,200 ms, while selected Zone A Metadata calls ran for 1,500 ms. Gateway returned on deadline; the server could still finish its handler. Both logs and cross-service traces support this sequence.
Trigger
During the incident phase, the load generator set delay_ms=1500 for a subset of Zone A calls.
The immediate cause is straightforward: server processing exceeded the caller’s deadline. On a production system, a similar symptom still requires you to explain why the handler slowed down—resource exhaustion, lock contention, or a downstream dependency, for example.
Also distinguish temporary recovery from resolution. A recurring problem can be serious even if each episode lasts only seconds. Repeatedly disabling the alert because the impact looks small is not a substitute for diagnosis.
2.6 Drive the Resolution
Mitigation and diagnosis can proceed in parallel:
- Recent high-impact deployment: consider pausing the rollout or reverting it; monitor error recovery.
- Single unhealthy instance with spare capacity: drain new traffic, while preserving logs and process state when possible.
- Capacity bottleneck: verify the bottleneck and scaling policy before adding instances.
- Downstream dependency: contact the owning team with failure ratio, time window, trace ID, and mitigations performed.
- Unknown root cause: state outstanding hypotheses; do not treat a temporary workaround as permanent resolution.
After the injected delay stopped, all 876 recovery-phase requests succeeded, and Mailpit received the P1 and P2 RESOLVED messages.
2026-11-02 local experiment
P2/Warning  --> FIRING --> RESOLVED
P1/Critical --> FIRING --> RESOLVED

Notification grouping and deduplication add delivery delay.
Metric recovery and email delivery are separate events.
Do not declare success solely because the email says RESOLVED. Check actual request success, timeout QPS, instance health, end-user behavior, and signs of recurrence.
Finally, tell the relevant owners which mitigations were made, which evidence supports recovery, and who will keep watching.
2.7 Document the Findings
A useful incident review is more than “it was a timeout.” Record:
- Initial symptom: the exact alert, metric meaning, and time.
- Priority decision: why this incident was handled first and what impact remains uncertain.
- Changes inspected: deployment/configuration history and its relation to the incident window.
- Hypotheses eliminated: no QPS surge, Zones B/C healthy, more than one Gateway affected.
- Drill-down path: time → environment → zone → instance → error code → logs → trace → code.
- Evidence versus assumptions: especially differences between caller and server observations.
- Mitigation and recovery proof: actions, metrics, alert state, and actual requests.
The same reasoning is useful for Redis timeouts, database connection exhaustion, and MQ backlogs without memorizing every platform click.
3. Practice With Other Failure Modes
RPC timeout is one case. The investigation pattern carries over to Redis, message queues, and databases, although the metrics and mechanisms differ.
| Area | First metrics to inspect | Next drill-down |
|---|---|---|
| Client | Error ratio, DNS/connect latency, deadlines, retries | Network, version, payload size, client limits and retry policy |
| Gateway/load balancer | Incoming QPS, status codes, upstream errors, route distribution | Routing rules, health checks, forwarding, connection reuse |
| Application service | RPC success, P95/P99, CPU/RSS, instance count | Code, locks, connection pools, threads/goroutines, dependencies |
| Redis | Command latency, connections, CPU, memory, hot keys | Slow commands, hot spots, capacity, network |
| MQ | Produce/consume rate, backlog, lag | Partitions, consumers, retry and dead-letter behavior |
| Database | Active connections, slow queries, lock waits, CPU/IO | Query plans, indexes, transactions, pools |
Low application CPU does not prove Redis is healthy. Adding consumers may not relieve an MQ backlog when partitions or downstream database throughput are the bottleneck.
Start with the precise meaning of the alert, then narrow the scope with dependency and error evidence.
4. Appendix: Six Questions Worth Investigating
The investigation raises six further questions. Can a rollout cause failures? How quickly does autoscaling help? How do you drain an instance while preserving evidence? Why do zones receive different request rates? Are instances balanced? Can failed instances be replaced automatically?
These exercises run in a separate Kind Kubernetes cluster:
One physical host
  ├── Kind control plane (1)
  ├── Kind Worker A: topology.kubernetes.io/zone=lab-zone-a
  ├── Kind Worker B: topology.kubernetes.io/zone=lab-zone-b
  └── Kind Worker C: topology.kubernetes.io/zone=lab-zone-c

Metadata Deployment: desired replicas = 6
Gateway Deployment: desired replicas = 1
Service / EndpointSlice: manage ready endpoints
Metrics Server: supplies resource metrics to HPA
All three worker nodes run on one host. They let us examine Kubernetes scheduling, rollouts, endpoints, and replication, not physical-zone network isolation.
The exercises share one Kind environment. Initialize it once using the README’s Kind setup instructions:
bash k8s/up.shYou can then run any appendix exercise without rebuilding the entire cluster.
4.1 Can a Deployment Cause Request Errors?
Reproduce: python3 k8s/rollout-traffic.py. It rolls a real Kubernetes Deployment while Kitex RPC requests remain in flight and writes results to evidence/. See the README.
Yes, it can—but a rolling update does not inevitably fail requests. Consider four separate factors.
4.1.1 Rollout Size and Timing
If too many instances exit at once, remaining instances may be overloaded. If new Pods have not become Ready before old Pods disappear, there can be a capacity gap.
For a Kubernetes Deployment:
strategy:
  type: RollingUpdate
  rollingUpdate:
    maxSurge: 1
    maxUnavailable: 1
The Deployment targets six server replicas, allows at most one extra Pod, and tolerates one unavailable Pod during the rollout. These settings govern rollout capacity; they do not specify how long every discovery cache takes to converge.
We ran two checks:
- Restart six Metadata Pods in a rolling fashion and confirm all return to Ready.
- Send 420 real Kitex RPC calls at about 10 QPS, with roughly 900 ms of work per call, while initiating a Rolling Restart.
All 420 requests returned HTTP 200 in that test. Different request durations, shutdown grace periods, or discovery delays can change the result.
4.1.2 Traffic Draining, Endpoints, and Discovery Convergence
A simplified sequence is:
Pod begins termination / readiness changes
         ↓
EndpointSlice updates ready endpoints
         ↓
Caller, proxy or Service routing observes the change
         ↓
In-flight requests and existing connections continue/finish
         ↓
Process exits or is force-terminated
Several components update asynchronously. Removing a Pod from EndpointSlice does not instantly close established TCP connections. A client reusing a connection to an exiting server can still see intermittent errors.
A Kubernetes Service and an RPC framework’s own discovery/connection cache are not identical. Measure when new routing stops, when the server stops accepting requests, whether in-flight work completes, and when old connections close.
4.1.3 Graceful Shutdown Versus Forced Termination
Kubernetes provides terminationGracePeriodSeconds and preStop, but these alone do not guarantee graceful termination. Application cooperation matters:
- Stop taking new requests or fail readiness.
- Allow upstream discovery and routing to converge.
- Wait for in-flight requests, with a defined limit.
- Close connections and exit within the grace period.
If preStop, Kitex draining, and the termination grace period are not coordinated, the process can still be killed while serving a request.
The current preStop sleep 3 only provides a short delay before exit. Full connection draining requires the Kitex server to stop accepting new work, complete in-flight requests, and account for caller-side connection reuse.
4.1.4 Problems Introduced by New Code
Even with a correct rolling mechanism, a new version may introduce incompatible serialization, configuration errors, business logic bugs, or unexpected downstream load.
Use error ratio and latency during the initial small traffic slice to decide whether to expand the rollout. When errors align with a deployment, pause or roll back before spending excessive time on a speculative root cause.
Deployment errors can stem from capacity, discovery/connection convergence, shutdown sequencing, or the code itself. Diagnose which one applies before tuning the rollout.
4.2 Why Might Autoscaling Arrive Too Late?
Reproduce: bash k8s/metrics-server.sh followed by bash k8s/hpa.sh. Watch the HPA’s desired replicas rather than treating a manual kubectl scale as automatic scaling.
When QPS and CPU rise, adding replicas sounds reasonable. But who detects the condition, how often is it evaluated, and when is a new instance actually Ready to receive traffic?
A simplified Kubernetes HPA path:
Pod CPU utilization rises
    ↓
Metrics Server gathers Pod CPU measurements
    ↓
HPA controller calculates desired replicas
    ↓
Deployment / ReplicaSet creates Pods
    ↓
Schedule to node → image available → container starts → readiness passes
    ↓
EndpointSlice adds the newly ready endpoints
    ↓
New connections/requests can reach the extra capacity
Every step takes time. A higher desired replica count is not yet additional Ready capacity.
In Kind, the resource HPA is configured as:
minReplicas: 6
maxReplicas: 9
metrics:
  - type: Resource
    resource:
      name: cpu
      target:
        type: Utilization
        averageUtilization: 65
We applied bounded CPU load to Metadata Pods. HPA observed CPU several times above target and raised desired replicas from 6 to 9. The experiment then removed the CPU load and HPA and restored six Pods. The adjustment was made by HPA based on CPU utilization, not by manual scaling.
A burst lasting just seconds may finish before HPA detection, Pod startup, and endpoint convergence can help. CPU may also remain low while a connection pool or downstream dependency saturates. Scaling in that case may not help and could increase downstream pressure.
4.3 How Do You Drain a Broken Instance Without Losing Evidence?
Reproduce: bash k8s/drain.sh. A Pod stays Running while Ready EndpointSlice entries change 6 → 5 → 6.
Restarting or deleting a Pod is easy, but it can destroy important process state: pools, stacks, heap contents, temporary files, and local logs.
If there is enough healthy capacity, stop sending new traffic to the suspect instance while leaving it running for diagnosis.
The readiness experiment observed:
Initially: six Metadata Pods Running + Ready
           EndpointSlice: six ready endpoints

Write a marker in one Pod:
           /tmp/oncall-not-ready

Observe:
           Pod phase remains Running
           /healthz returns 200 (liveness OK)
           /readyz returns 503 (not Ready)
           EndpointSlice ready endpoints: 6 → 5

Remove the marker:
           No Pod recreation needed
           /readyz returns 200
           EndpointSlice ready endpoints: 5 → 6
Replay it with:
bash k8s/drain.sh“Not accepting new routed traffic” and “process still alive” are independent states.
Two details matter:
- Removing an EndpointSlice entry may leave old TCP connections in use. Observe the proxy, Kitex connection pool, and in-flight requests when measuring actual draining.
- Preserving evidence must be balanced against ongoing business impact; an actively harmful instance may need to be stopped quickly.
Readiness affects Kubernetes routing eligibility. Weight-based draining through a service-discovery system needs separate tests for weight propagation and client-side cache convergence.
4.4 How Can You Judge Whether Traffic Is Balanced Across Zones?
Reproduce: use the main Docker experiment from section 0, inspect ZONE_ROUTES in compose.zones.yaml, and compare the weights against the Zone QPS panel in Grafana. Query examples are in the README.
The main incident showed higher QPS in Zone A than in B or C. Why?
First, identify which routing layers a request actually traverses. A typical service might look like:
End user
   ↓ DNS / CDN / ingress
Public gateway or edge proxy
   ↓ regional / zone-level traffic selection
Load balancer or API Gateway
   ↓ service discovery / proxy / application RPC client
Service instance
Architectures differ. Find the component that actually chooses the traffic destination before checking weights and health.
First: distinguish region, availability zone, and instance.
- A Region is a larger geographic or deployment area.
- A Zone / Availability Zone is a smaller fault domain.
- A Data Center is a physical facility; it need not map 1:1 to a cloud AZ.
- A Pod / container / instance is a workload unit, not a data center.
The lab-zone-a/b/c values in Kind are Kubernetes labels assigned to Worker Nodes, not independent physical AZs.
Second: compare total traffic before error ratios.
If three zones naturally receive 55%, 27%, and 18% of all requests, Zone A might have more absolute errors simply because it serves more traffic.
The important follow-up is whether the conditional failure ratio differs. In the main experiment, Zone A failed around 45% of calls while B/C failed 0%; higher traffic alone does not explain that concentration.
Third: inspect routing weights and health.
The load generator reads ZONE_ROUTES from compose.zones.yaml. In production also check:
- Does DNS/CDN pick the entry based on location or health?
- Are region/zone weights configured explicitly?
- Does failover routing, locality preference, canary rollout, or hash routing apply?
- How many healthy instances exist in each region, and do they have the same capacity?
- Are connections reused, sessions sticky, or requests hashed?
- Are there different latency or cost goals across regions?
“More instances means proportionally higher zone QPS” only holds under particular weight and routing assumptions. The three zones in this experiment each have two Metadata instances, but entry weights are 6:3:2. Those weights explain the aggregate traffic shares.
What if the entry shares are equal, but one instance still handles nearly all requests? That is the next question.
4.5 Is Request Load Necessarily Even Across Instances?
Reproduce: python3 k8s/load-balancing.py. Compare the actual Metadata Pod RPC counters rather than assuming Kubernetes Service evenly distributes each RPC.
For uneven instance load, inspect three dimensions.
First: are instance specifications the same?
CPU, memory, connection capacity, and deployed code can differ. An instance with less QPS can still bottleneck if it receives more expensive requests. Compare latency, CPU, connection counts, request composition, and per-request processing cost.
Second: are effective routing weights the same?
Some balancers support instance weights. A 1:2 split may approximate a 1:2 distribution of new traffic over a sufficiently long period, given the right balancing model. Verify runtime-effective weights, not just defaults in configuration files.
Third: what is the unit of load balancing?
In Kind, six Metadata Pods sit behind one Kubernetes Service. We sent 240 Kitex RPCs from the same Gateway, then measured each Pod’s rpc_server_requests_total counter delta:
Same Kubernetes Service:
240 real Kitex RPC calls

Metadata Pod 1: 240
Metadata Pod 2:   0
Metadata Pod 3:   0
Metadata Pod 4:   0
Metadata Pod 5:   0
Metadata Pod 6:   0
This does not mean Kubernetes always routes to the first Pod. It demonstrates that with one client and a reused long-lived TCP connection, ClusterIP connection selection and per-RPC request selection are different concepts.
Backend selected when the connection is established
Gateway ── one reused TCP connection ──> Metadata Pod 1
             |
             +-- RPC 1
             +-- RPC 2
             +-- ...
             +-- RPC 240
Six identical Pods do not imply that each receives exactly 40 RPCs.
For per-request balancing, investigate the RPC client’s discovery and balancing strategy, connection-pool model, L7 proxy behavior, weights, and existing connections. Verify the results with real connections and per-instance counters. Increasing replicas alone may leave the hotspot unchanged.
Always ask: does load balancing happen once per connection, once per RPC, or further upstream?
4.6 Can a Failed Instance Be Replaced Automatically?
Reproduce: bash k8s/lifecycle.sh. Observe ReplicaSet replacement after Pod deletion, rolling update behavior, and the return to six Ready replicas. This checks Kubernetes self-healing, not cross-data-center migration.
“Automatic migration” can mean several different operations:
- Container restart: a container restarts within the same Pod; Pod identity may stay the same.
- Pod replacement: a deleted or terminated Pod is replaced by ReplicaSet; UID and IP can change.
- Rescheduling onto another node: the new Pod lands on a different Node.
- Moving across fault domains: the workload genuinely leaves a failed zone, requiring independent fault domains and appropriate placement rules.
Delete a Pod and observe what ReplicaSet does:
kubectl -n oncall-lab delete pod <actual-metadata-pod-name>

kubectl -n oncall-lab rollout status deployment/metadata

kubectl -n oncall-lab get pods -o wide
ReplicaSet brings the Deployment back to 6/6 Ready. This demonstrates workload self-healing. To determine whether it also moved to another node or fault domain, compare old and new nodeName values.
The Deployment also defines:
topologySpreadConstraints:
  - maxSkew: 1
    topologyKey: topology.kubernetes.io/zone
    whenUnsatisfiable: DoNotSchedule
    labelSelector:
      matchLabels:
        app: metadata
One real observation was a 3/2/1 distribution across logical zones after a rollout, rather than a stable 2/2/2. Recreating Pods in the overrepresented zone restored balance.
Topology Spread Constraints guide placement when new Pods are scheduled. They do not automatically move all running Pods back to a perfect distribution. Continuous rebalancing requires separate descheduling, capacity, and maintenance policies.
For automatic instance replacement, ask:
- Detection: which signal causes replacement—liveness, Node NotReady, custom health checks, or business metrics?
- Disruption: are in-flight calls interrupted, is local state lost, and when is the new instance Ready?
- Fault domain: did the replacement land on another healthy node/AZ, and is capacity actually available there?
Recreating a Pod and evacuating a failed physical availability zone can involve very different engineering constraints.
5. Conclusion
We started with two alert emails and a failed-call metric.
We confirmed priorities and scope, inspected alert history and changes, checked overall traffic, and drilled down by zone and instance. The rpc_timeout code led us to Loki, and a correlated trace showed both client and server execution times. Finally, we matched the observations with the timeout configuration and handler code.
The conclusions were concrete:
- Where: Zone A, not all zones.
- One instance or multiple: both Gateway instances failed.
- Just more traffic: no; A receives more requests by design, but its conditional failure ratio is abnormal and B/C are healthy.
- Error type: Kitex RPC timeout on the client.
- Server behavior: the Metadata handler may continue for about 1,500 ms.
- Why the client fails first: its 1,200 ms RPC budget expires.
- Recovery proof: healthy requests return, timeout metrics drop, Grafana returns to Normal, and Mailpit delivers resolved messages.
The appendices examined rollouts, autoscaling, draining, cross-zone routing, per-instance balancing, and Pod replacement.
This workflow also applies to other RPC and dependency failures: narrow the impact first, then trace the request until you can explain the failure mechanism.
There is no silver bullet in software engineering. A method does not need to cover every incident to be useful. It should give the investigation an order: establish impact, test hypotheses, and find evidence that explains the observations.
Experiment Code and References
Repository: oncall-lab. Setup and verification are in section 0; configuration and the appendix exercises are documented in the English README and Chinese README.
Useful references: CloudWeGo Kitex, Kitex Prometheus instrumentation, Grafana Explore, Kubernetes Deployment, Pod Topology Spread Constraints, and HPA.
Drag to pan, scroll to zoom, and click a node to expand or collapse it. Large maps start with deeper levels collapsed; click nodes to expand them.
Discussion
Sign in with GitHub to comment. Discussions are stored as GitHub Issues.View on GitHub