
NOTE
4.2 pprof
1. What pprof is Golang performance analysis tool. 2. How to use pprof runtime/pprof, net/http/pprof, benchmark 3. How pprof works 4. References
This is a historical learning note and may contain outdated or incomplete understanding.
1. What Is pprof?
Golang’s performance analysis tool.
2. How to Use pprof
There are two libraries:
runtime/pprof: collect runtime data from tool-style applications for analysis
net/http/pprof: collect runtime data from web applications for analysis
benchmark: load testing
2.1. runtime/pprof
2.1.1. CPU Analysis
Assume the application is as follows:
import (
	"fmt"
	"time"
)

// A problematic piece of code
func logicCode() {
	var c chan int
	for {
		select {
		case v := <-c:
			fmt.Printf("recv from chan, value:%v\n", v)
		default:
		}
	}
}

func main() {
	for i := 0; i < 8; i++ {
		go logicCode()
	}
	time.Sleep(20 * time.Second)
}
To enable CPU analysis, the steps are as follows:
- Import the package:
import "runtime/pprof" - Start CPU profiling:
pprof.StartCPUProfile(w io.Writer)+ stop CPU profiling:pprof.StopCPUProfile()The code is as follows:
import (
	"fmt"
	"os"
	"runtime/pprof"
	"time"
)

// A problematic piece of code
func logicCode() {
	var c chan int
	for {
		select {
		case v := <-c:
			fmt.Printf("recv from chan, value:%v\n", v)
		default:
		}
	}
}

func main() {
	// Start CPU analysis
	file, err := os.Create("./cpu.pprof")
	if err != nil {
		fmt.Printf("create cpu pprof failed, err:%v\n", err)
		return
	}
	pprof.StartCPUProfile(file)
	defer pprof.StopCPUProfile()

	for i := 0; i < 8; i++ {
		go logicCode()
	}
	time.Sleep(20 * time.Second)
}- Run the code to generate the report
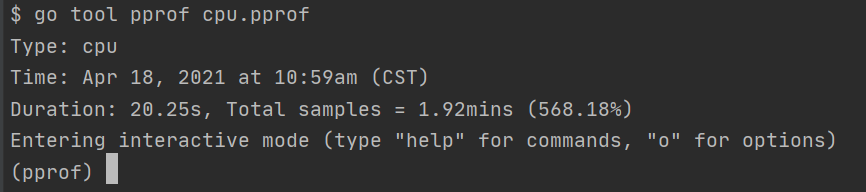
- Command-line analysis
go tool pprof cpu.pprof- Several important commands:
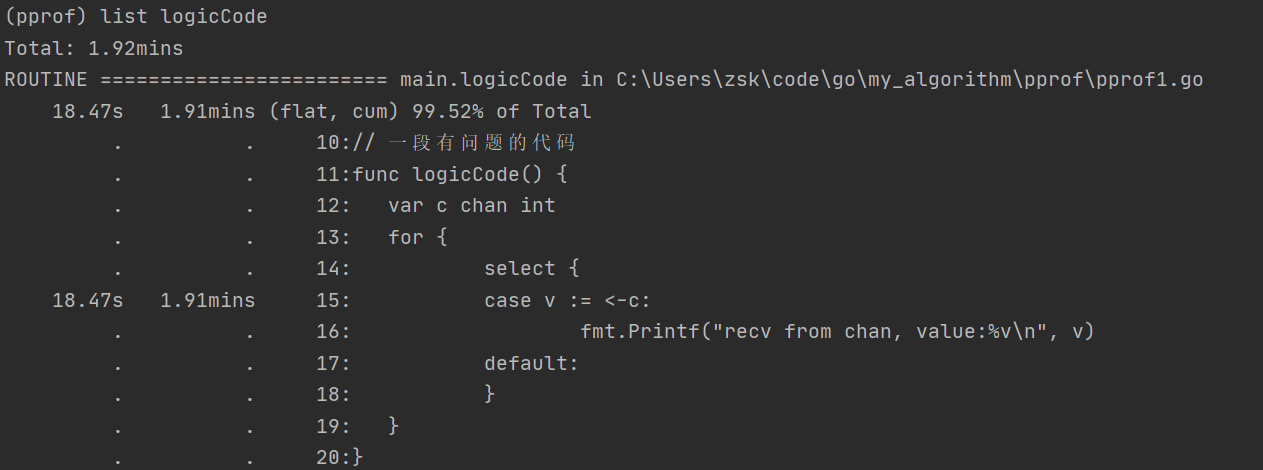
top: find the functions in our code that consume a lot of CPU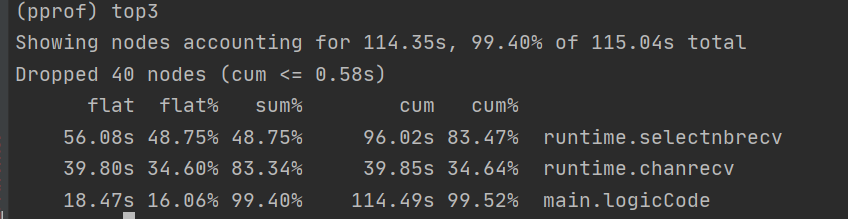
- flat: CPU time consumed by the current function. For example,
runtime.selectnbrecvconsumes 56.08s, excluding called child functions - flat%: percentage of CPU time consumed by the current function. For example,
runtime.selectnbrecvconsumes 48.75% of CPU time, excluding called child functions - sum%: cumulative percentage of CPU time consumed by this function and the functions above it, i.e. the accumulation of flat%. For example,
mainlogicCodeand the functions above it consume 48.75+34.60+16.06=99.41% of the time - cum: total CPU time consumed by the current function plus the functions called by the current function. For example,
runtime.selectnbrecvconsumes 96.02s, including called child functions. You can usetop -cumto sort by cum - cum%: percentage of total CPU time consumed by the current function plus the functions called by the current function. For example,
runtime.selectnbrecvconsumes 83.47% of CPU time, including called child functions - last column: function name
- flat: CPU time consumed by the current function. For example,
list function-name: view source codeweb: view the report graphically (graphviz needs to be installed)
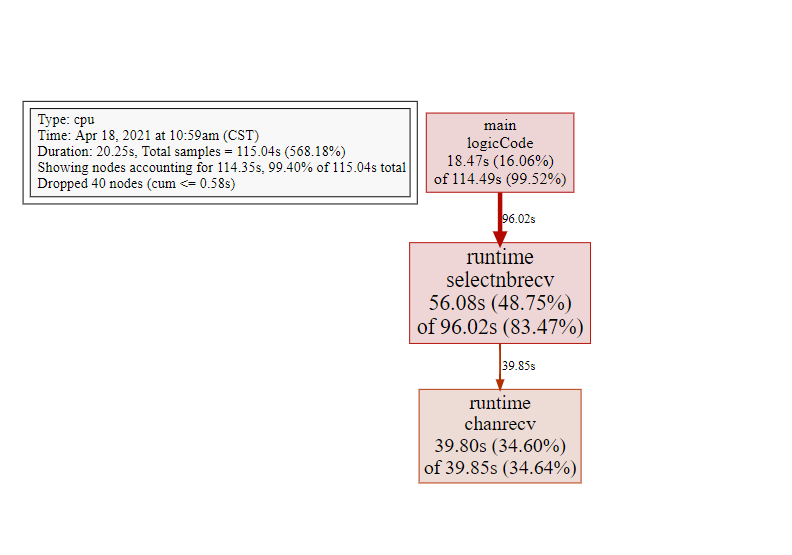
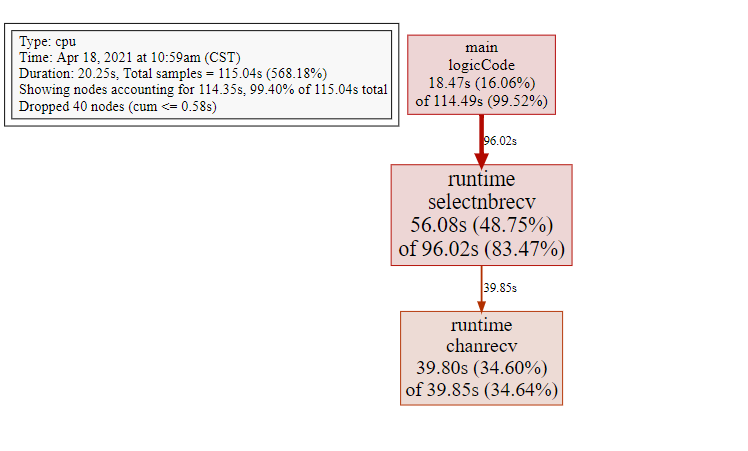
- Edge: call
- Represents A calling B; a dashed line means some unimportant intermediate function calls are omitted
- The value on the connection represents the time consumed by the child function
- Node: function
- The more CPU time it consumes, the larger and redder the graph becomes
- The
main.logicCodefunction itself consumes 18.47s, accounting for 16.06%; the function and its child functions consume 114.49s, accounting for 99.52%
- Edge: call
- Browser analysis
go tool pprof -http=:9090 cpu.pprof- The
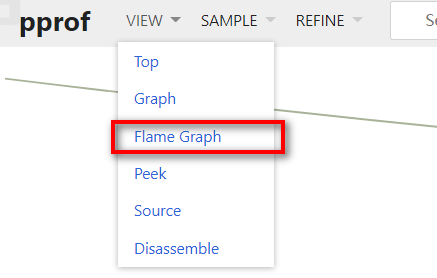 flame graph.md (the related note has not been published yet) is especially useful
- Modify the code

func logicCode() {
	var c chan int
	for {
		select {
		case v := <-c:
			fmt.Printf("recv from chan, value:%v\n", v)
		default:
			time.Sleep(time.Second)
		}
	}
}- Run the analysis again
- You can see that there is no longer a case where our own code has high usage
2.1.2. Memory Analysis
The steps are as follows:
- Import the package:
import "runtime/pprof" - Record the program’s heap information:
pprof.WriteHeapProfile(w io.Writer)The code is as follows:
port (
	"fmt"
	"os"
	"runtime/pprof"
	"time"
)

func main() {
	// Start memory analysis
	file, err := os.Create("./memory.pprof")
	if err != nil {
		fmt.Printf("create cpu pprof failed, err:%v\n", err)
		return
	}
	pprof.WriteHeapProfile(file)

	for i := 0; i < 8; i++ {
		go logicCode()
	}
	time.Sleep(20 * time.Second)
}- Run the code to generate the report
- Command-line analysis
go tool pprof -inuse_space memory.pprofgo tool pprof -inuse_objects memory.pprof

2.1.3. Blocking Analysis
In the Go programming language, what happens when a goroutine blocks? - Quora
2.2. net/http/pprof
Assume the web application is as follows:
func main() {
	go func() {
		http.ListenAndServe("0.0.0.0:9999", nil)
	}()
}
To enable analysis, the steps are as follows:
- Import the package:
import _ "net/http/pprof"
import _ "net/http/pprof"
func main() {
	go func() {
		http.ListenAndServe("0.0.0.0:9999", nil)
	}()
}- Use a browser to visit
http://127.0.0.1:9999/debug/pprof/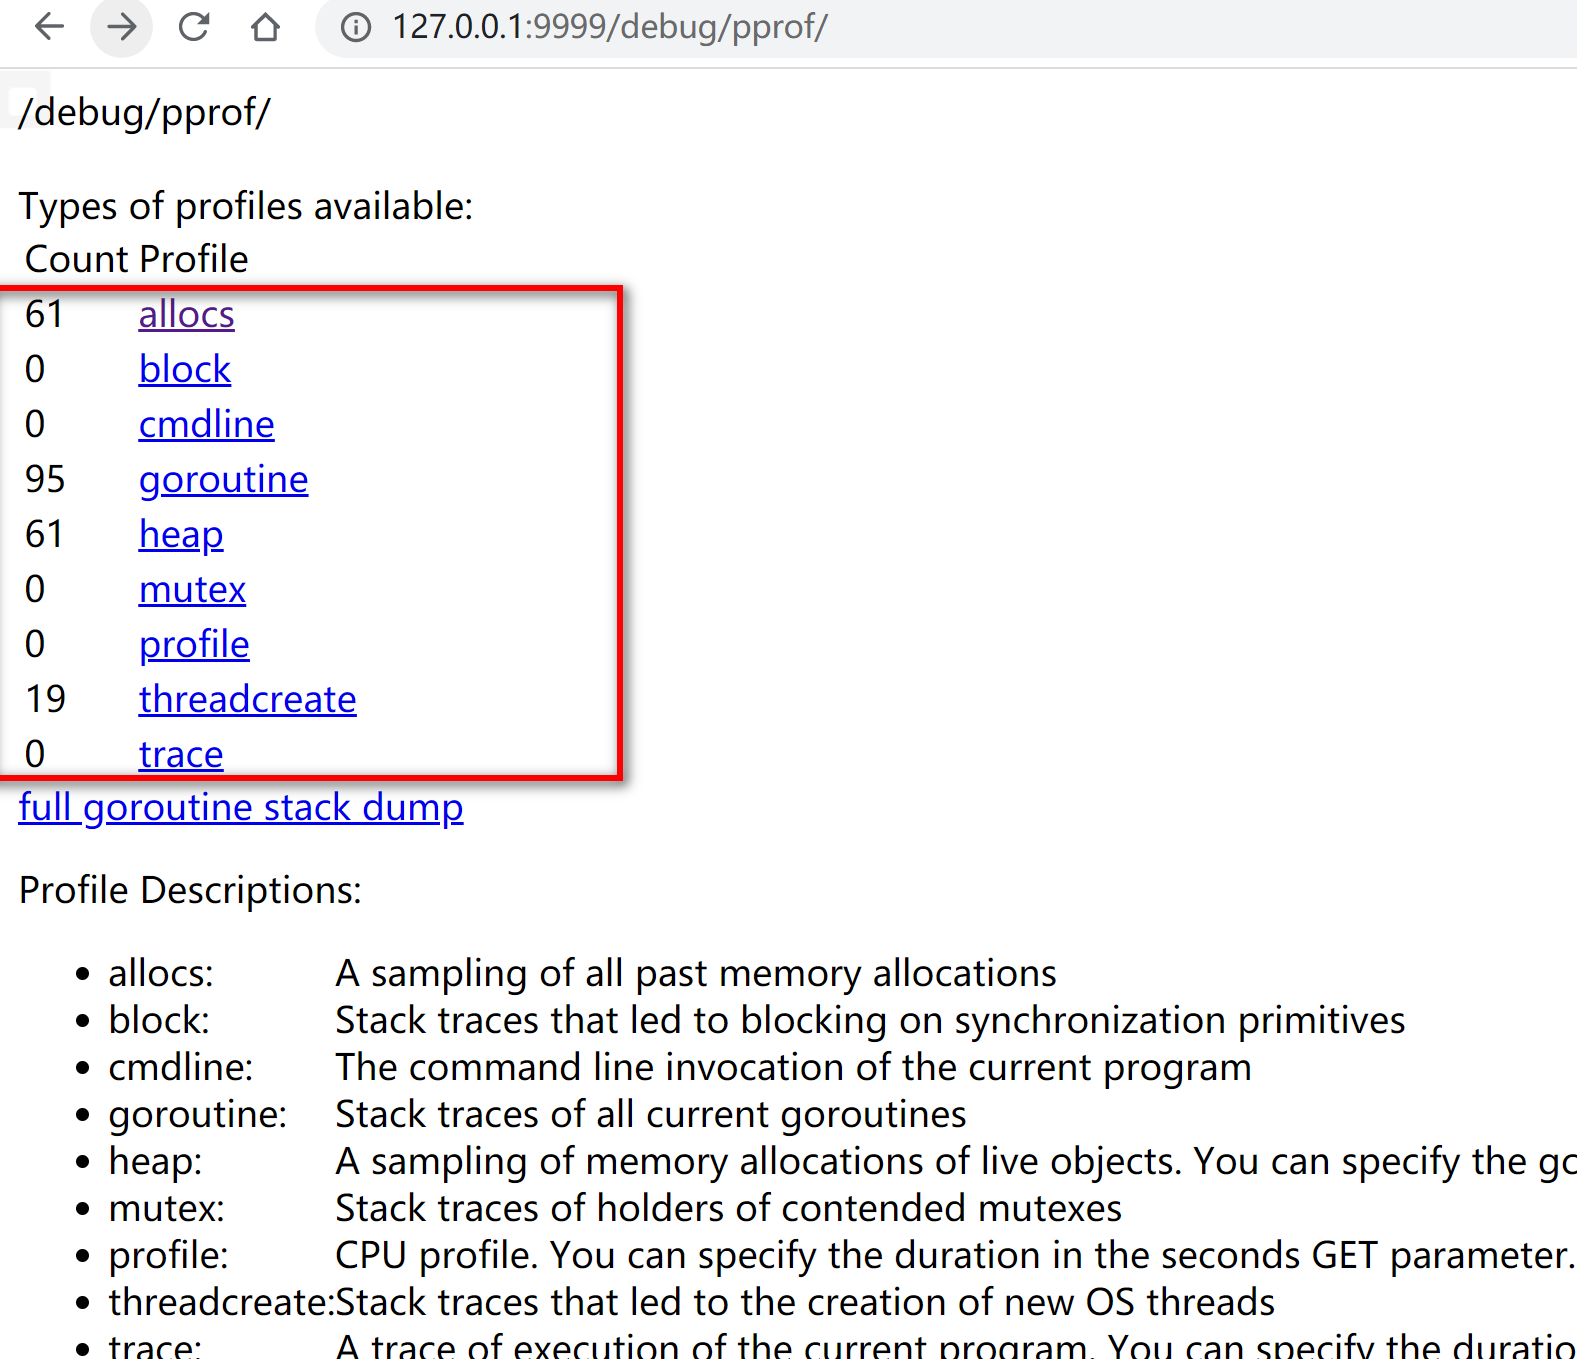
- Click different endpoints to view them
- Memory:
allocs,heap - CPU:
profile - Threads:
threadcreate - Goroutines:
goroutine
- Memory:
- In addition to viewing them in real time with a browser, you can also use
go tool pprofto inspect different endpoints
go tool pprof http://localhost:9999/debug/pprof/allocs
go tool pprof http://localhost:9999/debug/pprof/heap
go tool pprof http://localhost:9999/debug/pprof/goroutine
go tool pprof http://localhost:9999/debug/pprof/threadcreate
go tool pprof http://localhost:9999/debug/pprof/profile- You can also save a snapshot at that point for later analysis
curl http://localhost:9999/debug/pprof/allocs > allocs.out
curl http://localhost:9999/debug/pprof/heap > heap.out
curl http://localhost:9999/debug/pprof/goroutine > goroutine.out
curl http://localhost:9999/debug/pprof/threadcreate > threadcreate.out
curl http://localhost:9999/debug/pprof/profile > profile.out
Then analyze it with go tool pprof, the same as for tool-style applications.
2.3. benchmark
3. How pprof Works
Sampling: after it is enabled, stack information is collected at intervals (10 ms) to obtain the CPU, memory, and other resources consumed by each function. Analysis: analyze this sampled data to form a performance-analysis report.
4. References
- Deep Dive into Go pprof | qcrao
- Golang Performance Profiling with PProf - SegmentFault
- Go Performance Tuning | Li Wenzhou’s Blog
- Go pprof in Practice - QQ Music Project - KM Platform (internal link removed)
- Memory Leaks: 8 Goroutine Leaks and 1 Real Memory Leak - rsapaper_ing - CNBlogs
- Golang pprof in Practice | Wolfogre’s Blog
- Go pprof in Practice - Tencent Cloud
- Understanding pprof in One Article - CSDN Blog
- Cost Reduction and Efficiency Improvement: a tRPC-Go Plugin That Can Save 30% CPU Resources - KM Platform (internal link removed)
- tRPC-Go: The Road to Performance Optimization - KM Platform (internal link removed)
- How I investigated memory leaks in Go using pprof on a large codebase
- An Introduction to go tool trace
- Difference Between flat and cum in pprof - CSDN Blog
- linux - Pprof and golang - how to interpret a results? - Stack Overflow
- Profiling and Optimizing Go - YouTube
- Go Profiling and Optimization - Google Slides
- Commits · prashantv/go_profiling_talk
- [golang] 7 Ways to Analyze Go Program Performance - landv - CNBlogs
- Golang Memory Analysis / Dynamic Tracing — Source Code
Discussion
Sign in with GitHub to comment. Discussions are stored as GitHub Issues.View on GitHub