
NOTE
Relative Valuation
English translation of the original VNote “Relative Valuation”, preserving its structure with only necessary small corrections.
This is a historical learning note and may contain outdated or incomplete understanding.
1. What Is Relative Valuation?
Relative valuation is a valuation method that compares price multiples such as P/E, P/B, and P/S across a target company and comparable companies. If the target company’s multiple is lower, it may indicate a lower relative valuation, but that alone does not guarantee that its stock price will rise.
2. Relative-Valuation Price Multiples
2.1. Price-to-Earnings Ratio (P/E)
2.1.1. What Is It?
-
P/E = price per share / earnings per share- Price per share uses the latest closing price.
- Earnings per share, or EPS, can be measured in different ways.
- Using the latest reported annual EPS gives a historical P/E.
- Using the market’s average forecast, often based on analyst estimates, gives a forward/estimated P/E.
-
It can be interpreted as how many years of current earnings the price represents if all earnings were distributed and earnings stayed unchanged.
Company Stock Price EPS P/E Simplified Payback Time A 100 5 20 20 years B 1000 100 10 10 years Although Company A has a lower nominal share price, its P/E is 20; under the simplified assumption that all earnings are distributed and remain unchanged, it corresponds to 20 years of current earnings. Company B’s P/E is 10.
-
A lower P/E means the price is lower relative to current or historical earnings, but it does not automatically mean the stock has greater investment value. Earnings quality, growth, cyclicality, and risk still matter.
-
Common forms include static P/E, forward/dynamic P/E, and trailing P/E:
- Static P/E = market capitalization / last year’s net profit; the profit data may be stale.
- Forward/dynamic P/E = market capitalization / estimated full-year net profit; the forecast may be inaccurate.
- Trailing P/E (P/E TTM) = market capitalization / net profit over the latest 12 months.
2.1.2. Applicable Scenarios
- Compare companies in the same industry.
- Compare a company with its own historical P/E.
- P/E percentile: the percentile rank of current P/E within a selected historical interval, such as the last ten years. For example, a 20th percentile means only 20% of observations were lower than the current P/E.
- Generally, above 70% is considered overvalued and below 30% undervalued.
- P/E percentile: the percentile rank of current P/E within a selected historical interval, such as the last ten years. For example, a 20th percentile means only 20% of observations were lower than the current P/E.
- More applicable to profitable companies or industries with relatively stable profit growth, such as some pharmaceutical or food-and-beverage companies.
2.1.3. Use
2.1.3.1. Market-Capitalization Forecast
- Multiplying both numerator and denominator by total shares gives
P/E = market capitalization / net profit, somarket capitalization = net profit × P/E. Forecasting net profit and P/E can therefore produce an estimated market capitalization.- Net-profit forecasts can refer to securities analysts.
- Ways to estimate P/E include:
- PEG
- Industry-average P/E. Problem: quality can vary greatly among companies in the same industry.
- A company’s historical valuation, such as a P/E band. Problem: not suitable when fundamentals have deteriorated.
- After estimating future market capitalization, discount it to present value, compare it with current value, and consider the required return.
How to Analyze a Company.md (original VNote internal link; not migrated yet)
2.1.3.2. Davis Effect
- A double-multiple effect involving market expectations and listed-company price movements.
Price (P) = EPS × P/E- Davis double play: earnings/EPS rise while the market also awards a higher valuation multiple, multiplying the stock-price increase.
- Davis double kill: earnings/EPS fall while the valuation multiple also contracts, multiplying the stock-price decline.
2.2. PEG
2.2.1. What Is It?
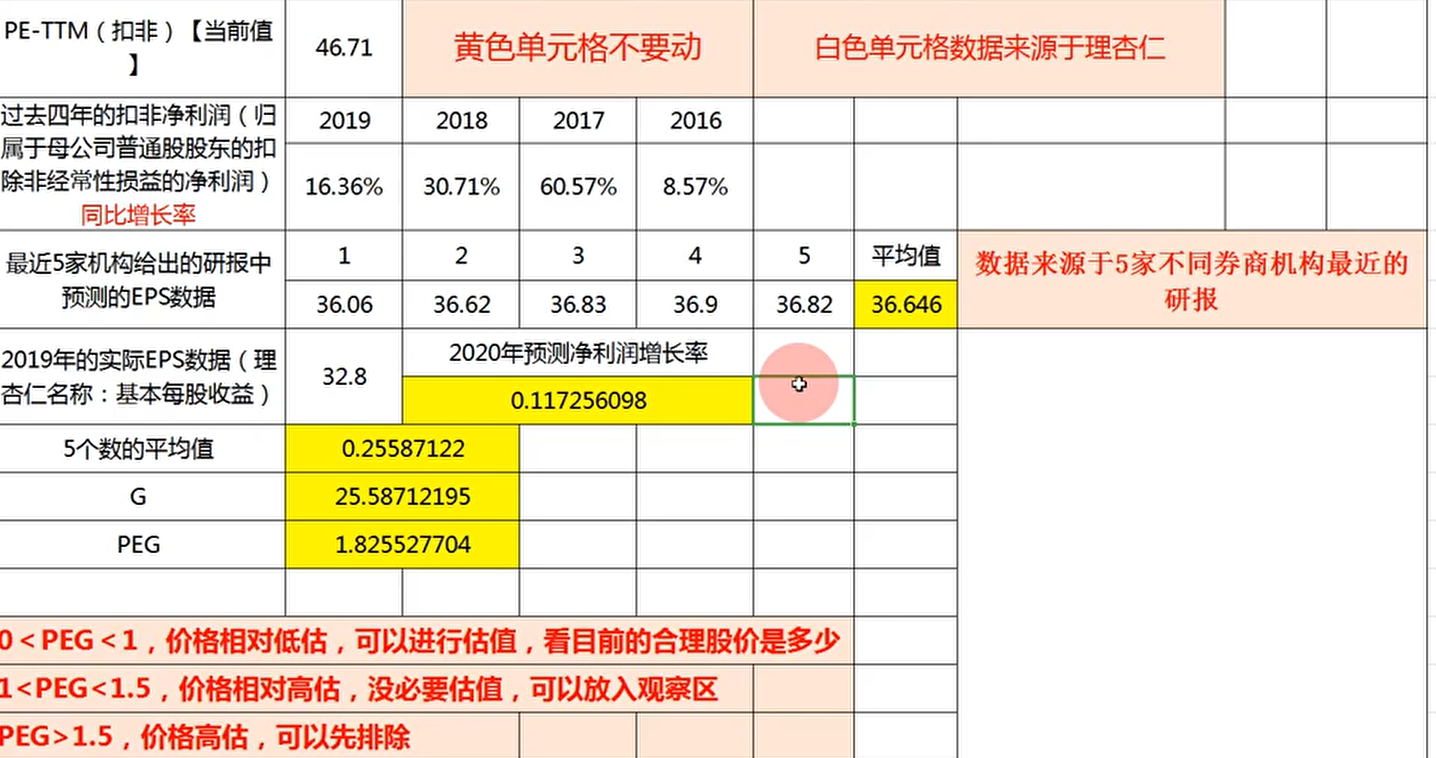
PEG = forward P/E / estimated future EPS growth rate- Forward P/E: current P/E can be used as a proxy, but the P/E and growth-rate definitions should remain consistent.
- Estimated future EPS growth: may use a market-consensus estimate assembled from analyst forecasts.
Calculation:
PEG = adjusted P/E TTM / G- Adjusted P/E TTM: source recorded as Lixinger.
- G:
{four years of adjusted net-profit growth + forecast net-profit growth from five brokerages} / 5 × 100- Historical adjusted net-profit growth: Lixinger
- Forecast net-profit growth: research reports or brokerage software
2.2.1.1. P/E vs. PEG
PEG attempts to complement P/E by incorporating growth. A high-P/E company may also have high expected growth, but the forecast itself is uncertain and the P/E/growth-rate conventions need to be consistent.
2.2.2. Use
2.2.2.1. Judging Whether P/E Is High or Low
- PEG greater than 1 may mean the stock is priced high relative to the assumed growth rate, or that the market expects growth above the estimate.
- PEG below 1 may mean the stock is priced low relative to the assumed growth rate, or that the market expects growth below the estimate.
These interpretations depend heavily on the quality and stability of the growth forecast.
2.3. Price-to-Book Ratio (P/B)
2.3.1. What Is It?
P/B = market capitalization / book equity attributable to common shareholders- A simplified bridge is
total assets - total liabilities - preferred equity; subtracting goodwill/intangible assets produces a tangible-book-value style denominator and should not be confused with the ordinary P/B denominator.
- A simplified bridge is
P/B = price per share / book value per share- A lower P/B only means that the market price is lower relative to book net assets. It does not necessarily mean lower risk; asset quality, profitability, and industry characteristics still need separate analysis.
2.3.1.1. P/B vs. P/E
- P/E measures how much investors pay for each unit of earnings. A high P/E can reflect expectations of stronger future earnings growth.
- P/B measures how much investors pay for each unit of book net assets. A low P/B means a lower market price per unit of book value, but whether the stock is undervalued still depends on asset quality, ROE, industry characteristics, and earnings prospects.
2.3.2. Applicable Scenarios
- Compare companies in the same industry.
- Compare a company with its historical P/B.
- P/B percentile: the percentile rank of the current P/B within a selected historical interval, such as ten years.
- More applicable to industries with substantial tangible assets, such as banks and real estate.
2.3.3. Use
2.4. Price-to-Sales Ratio (P/S)
2.4.1. What Is It?
P/S = price per share / sales per share- Market value corresponding to each unit of sales.
2.4.1.1. P/E vs. P/S
For mature companies with relatively stable earnings, P/E is commonly used. For companies that are not yet profitable but have comparable revenue, P/S can be a supplementary reference; it is not inherently more reliable and still depends on margins, growth quality, and capital intensity.
2.4.2. Applicable Scenarios
- Valuing unprofitable companies
- Cyclical industries, with appropriate caution
2.4.3. Use
A lower P/S does not automatically mean greater investment value. Profit margin, growth quality, capital intensity, and industry comparability still matter.
2.5. Price-to-Cash-Flow Ratio
2.5.1. What Is It?
Price-to-cash-flow = market capitalization / operating cash flow
It measures how many times operating cash flow the market capitalization represents.
2.5.2. Use
A lower ratio generally means the market price is lower relative to operating cash flow, but whether that indicates better value still depends on cash-flow quality, growth, and industry characteristics.
2.6. Dividend Yield
2.6.1. What Is It?
Dividend yield = total dividends for one year / current stock price
If a stock price is RMB 10 and annual dividends are RMB 0.5, the dividend yield is 0.5 / 10 × 100% = 5%.
2.6.2. Use
Compare with a low-risk reference rate such as short-term government-bond yields.
If dividend yield remains above such a reference for several years, it can be used as one input for income and valuation analysis, but dividend sustainability, growth, and risk still need to be considered.
2.7. Return on Equity (ROE)
Accounting.md (original VNote internal link; not migrated yet)
3. References
- Price-to-book ratio - Baidu Baike
- Dividend-yield valuation article - Zhihu
- ROE valuation article - Zhihu
- P/B and valuation percentile - Zhihu
- Earnings-yield method - Zhihu
- Davis Effect - Zhihu
- Qieman Daily Valuation
- Relative valuation - Baidu Baike
- Danjuan Funds
- Investment Basics I: Relative Valuation - Zhihu
- P/E, P/B, and P/S comparison
Discussion
Sign in with GitHub to comment. Discussions are stored as GitHub Issues.View on GitHub