
NOTE
3.1 Grafana
Grafana installation and basic Prometheus data-source usage.
This is a historical learning note and may contain outdated or incomplete understanding.
1. Download Grafana
- Download Grafana | Grafana Labs
- Select Standalone Linux Binaries (64 Bit).
2. Extract and Start Grafana
tar -xvf grafana*.tar.gz
cd grafana*
./grafana-server
3. Open in the Browser
- http://localhost:3000/
- Username and password: admin/admin
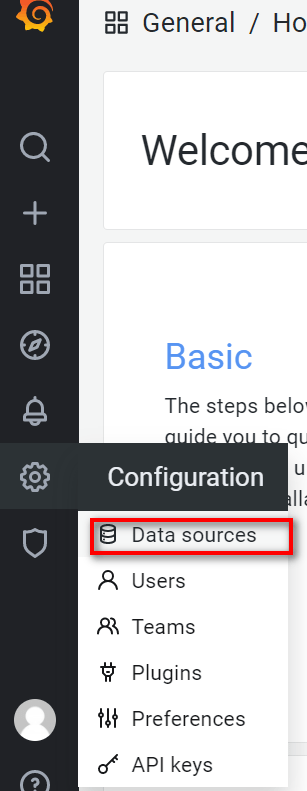
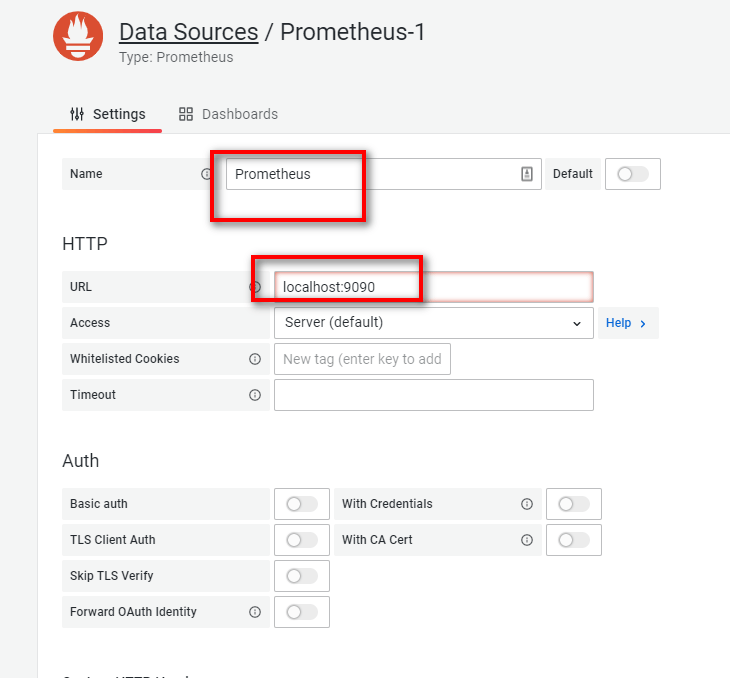
4. Add a Prometheus Data Source
4.1. Configure the Prometheus Data Source
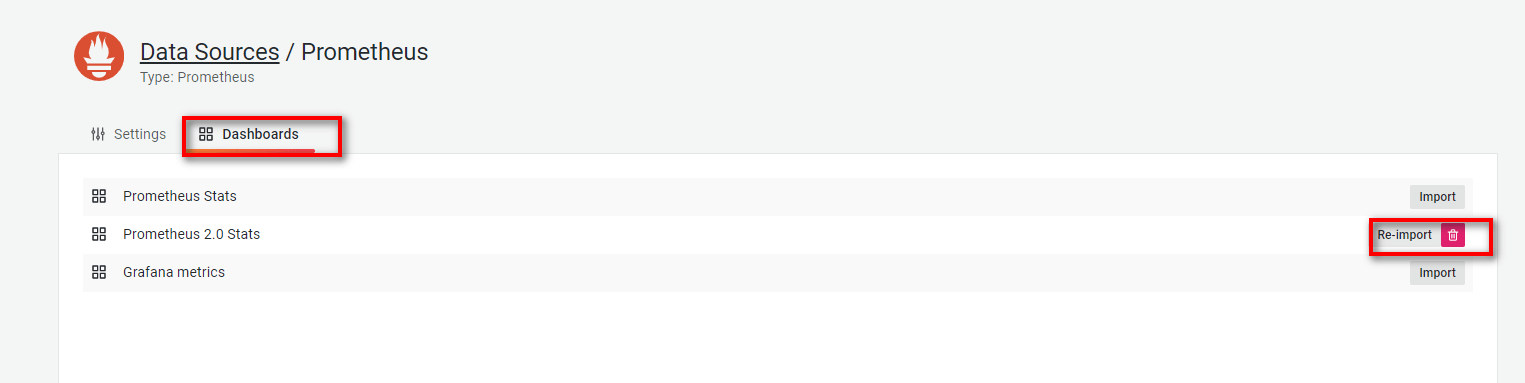
4.2. Import the Prometheus Data Source
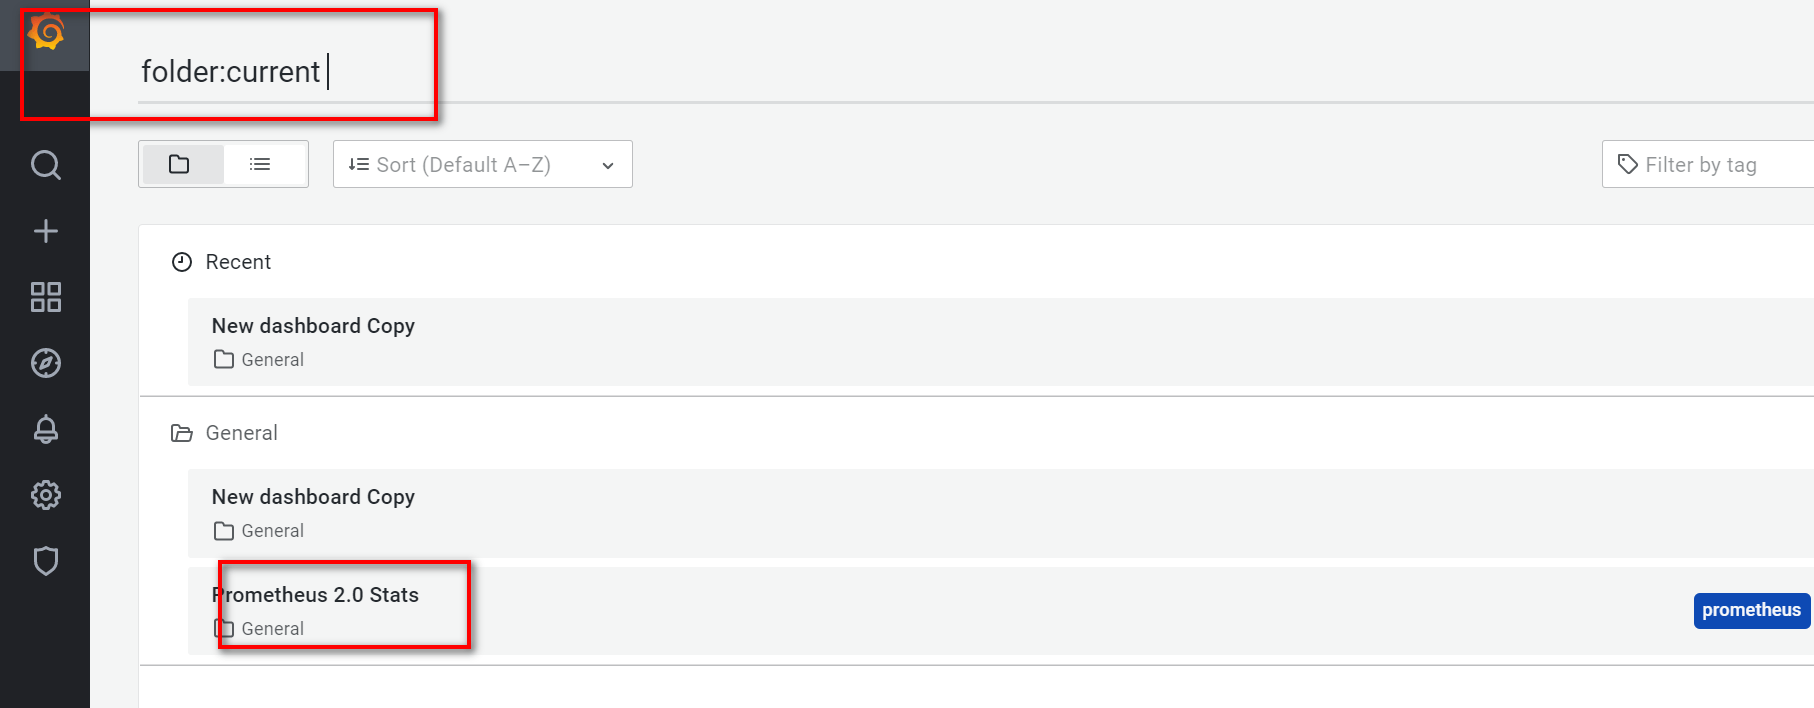
4.3. View the Prometheus Data Source
4.4. Edit the Chart
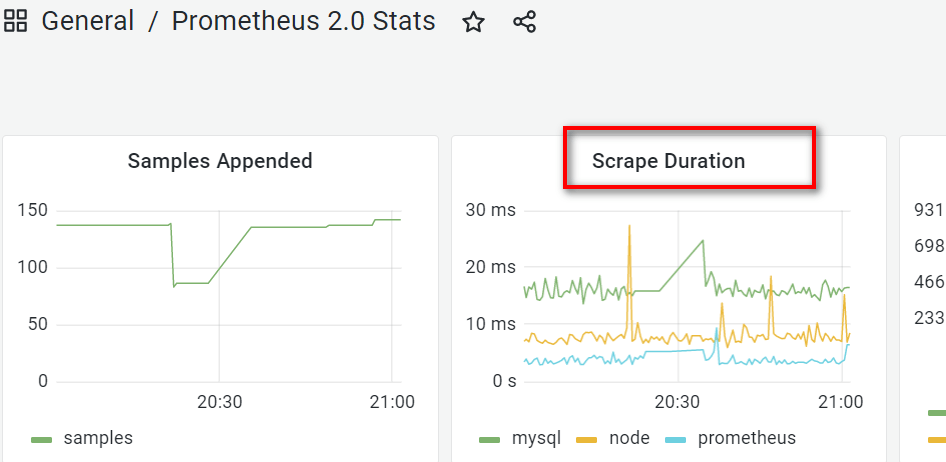
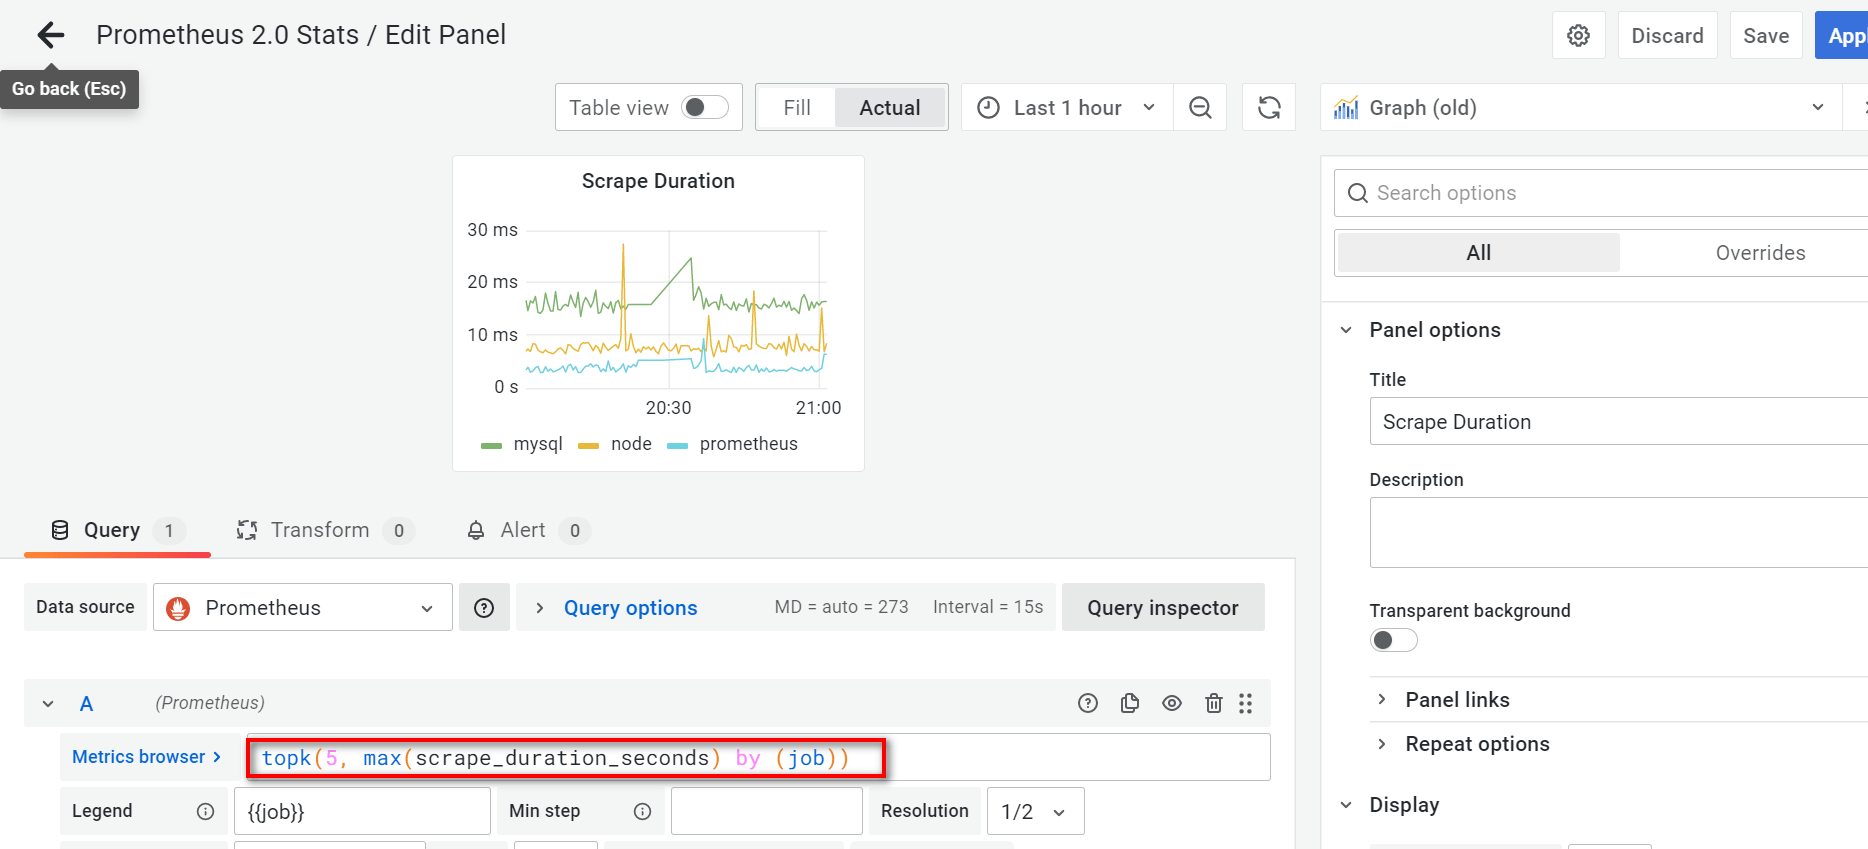
- The above is actually a Prometheus query.
Discussion
Sign in with GitHub to comment. Discussions are stored as GitHub Issues.View on GitHub