
NOTE
2.1 Prometheus
Prometheus role, architecture, and core components.
This is a historical learning note and may contain outdated or incomplete understanding.
1. What Is Prometheus
- A metrics monitoring system.
2. Prometheus Architecture
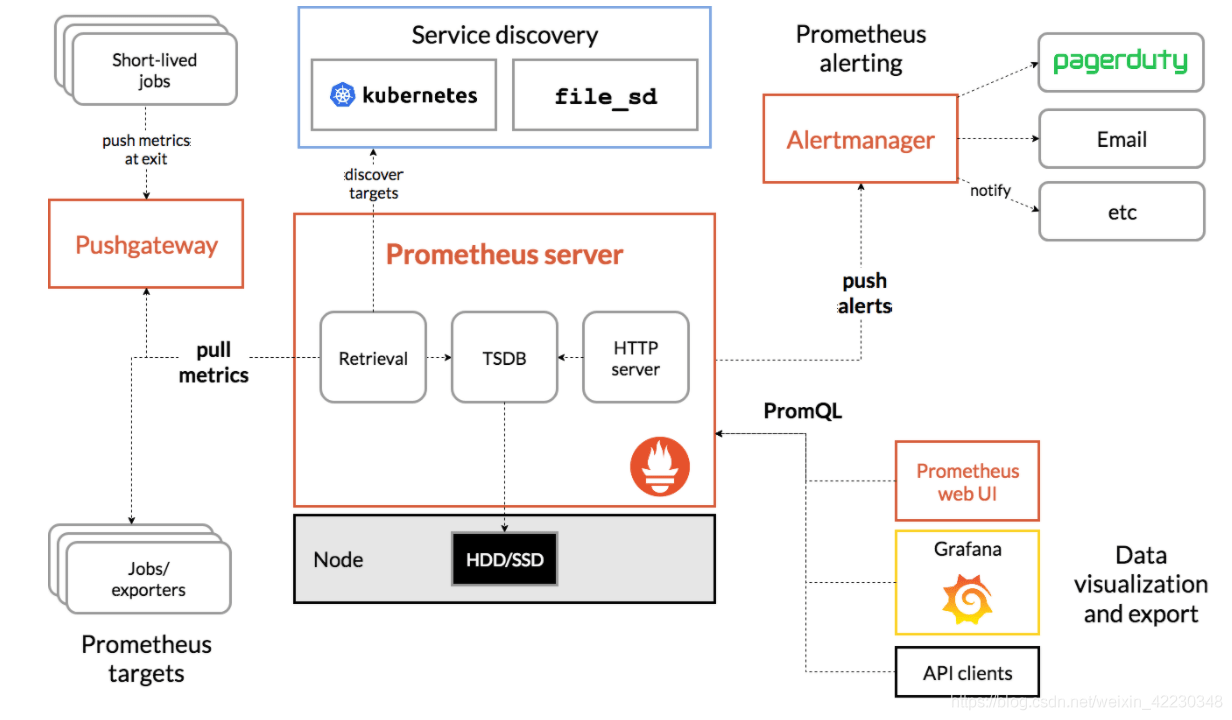
- Prometheus Server: pulls monitoring data from Exporters or PushGateway and stores it in the TSDB for later queries.
- Exporters: provide HTTP interfaces for Prometheus Server to pull monitoring data.
- PushGateway: for short-lived tasks and similar workloads that are not suitable for continuous Prometheus scraping, monitoring data can first be pushed to PushGateway, and Prometheus Server then pulls the data from PushGateway.
- Alertmanager: alert rules are created with PromQL. If a rule is satisfied, an alert is generated, and the subsequent alert-handling process is managed by Alertmanager, for example sending email.
Discussion
Sign in with GitHub to comment. Discussions are stored as GitHub Issues.View on GitHub