
NOTE
Network Tuning
1. Network Performance Metrics 1.1. Network Layer It is mainly responsible for network packet encapsulation, addressing, routing, sending, and receiving. Performance metric: Number of network packets that can be processed per second, PPS. The kernel'
This is a historical learning note and may contain outdated or incomplete understanding.
1. Network Performance Metrics
1.1. Network Layer
- It is mainly responsible for network-packet encapsulation, addressing, routing, sending, and receiving.
- Performance metric:
- Number of network packets that can be processed per second, PPS.
- The kernel’s built-in packet-generation tool
pktgencan be used for testing.
1.2. Transport Layer
- It is mainly responsible for network transmission.
- Performance metrics:
- Throughput (BPS)
- Number of connections and latency
iperfornetperfcan be used to test transport-layer performance.
1.3. Application Layer
- Performance metrics:
- Throughput (BPS)
- Requests per second
- Latency
- Tools such as
wrkandabcan be used to test application performance.
2. Network Performance Tools
2.1. sar
2.2. nethogs
2.3. iftop
2.4. netstat
2.5. ping
2.6. traceroute
2.7. nslookup
2.8. dig
2.9. tcpdump
2.10. wireshark
3. How to Analyze Network Performance Bottlenecks
3.1. Check Whether It Is an I/O Bottleneck
- Use
topto check CPU load (load average) and CPU utilization (%Cpu). If the former is high and the latter is low, then the bottleneck is network I/O or disk I/O.
3.2. Check Whether It Is a Network I/O Bottleneck
Use top to check whether iowait is relatively high. If so, it may be a disk I/O bottleneck; use iostat -xdk 1 10 to check whether %util is relatively high. If so, it is indeed a disk I/O bottleneck.
If both are low, then it is a network I/O problem.
3.3. Find the Process with High I/O Usage
- Use
iftopto find the IP:Port consuming the most traffic. - Use
netstatto find the process PID corresponding to the IP:Port. ps -e -L h o state,cmd | awk '{if($1=="R"||$1=="D"){print $0}}' | sort | uniq -c | sort -k 1nr
3.4. Analyze the Process
- Latency problem: use
pingortracerouteto check whether latency between the two machines is relatively high, and solve it by deploying in the same region and similar methods. - Bandwidth problem: use tools such as
pktgento test bandwidth, and tools such assar -n DEV 1to check the currently used bandwidth. If it exceeds the limit, then it is a network I/O bottleneck.- Data-volume problem: use
tcpdump -i interface-name -v -nn tcp port port-number -w test.capto capture packets on the business server and storage server; use Wireshark to analyze whether packet fragmentation exists. If so, compress according to the application logic. Suppose QPS is 100K and the packet size is 4K, then 3.2 Gbit/s of bandwidth is required, so a 10 Gbit/s link is needed.
- Data-volume problem: use
- Duplicate-packet/packet-loss problem: use
tcpdump -i interface-name -v -nn tcp port port-number -w test.capto capture packets on the business server and storage server; use Wireshark to analyze whether duplicate packets / packet loss exist. If so, work with operations to handle it. - Connection-count problem: use
netstat -antp |awk '/tcp/ {print $6}' |sort|uniq -cto check the number ofESTABLISHEDconnections. If it is too small, it may be a connection-pool problem.
4. Packet Loss
4.1. Check Whether There Is Packet Loss
dmesg | grep "TCP: drop open request from"
netstat -ant|grep SYN_RECV|wc -l
4.2. Analyze the Cause of Packet Loss
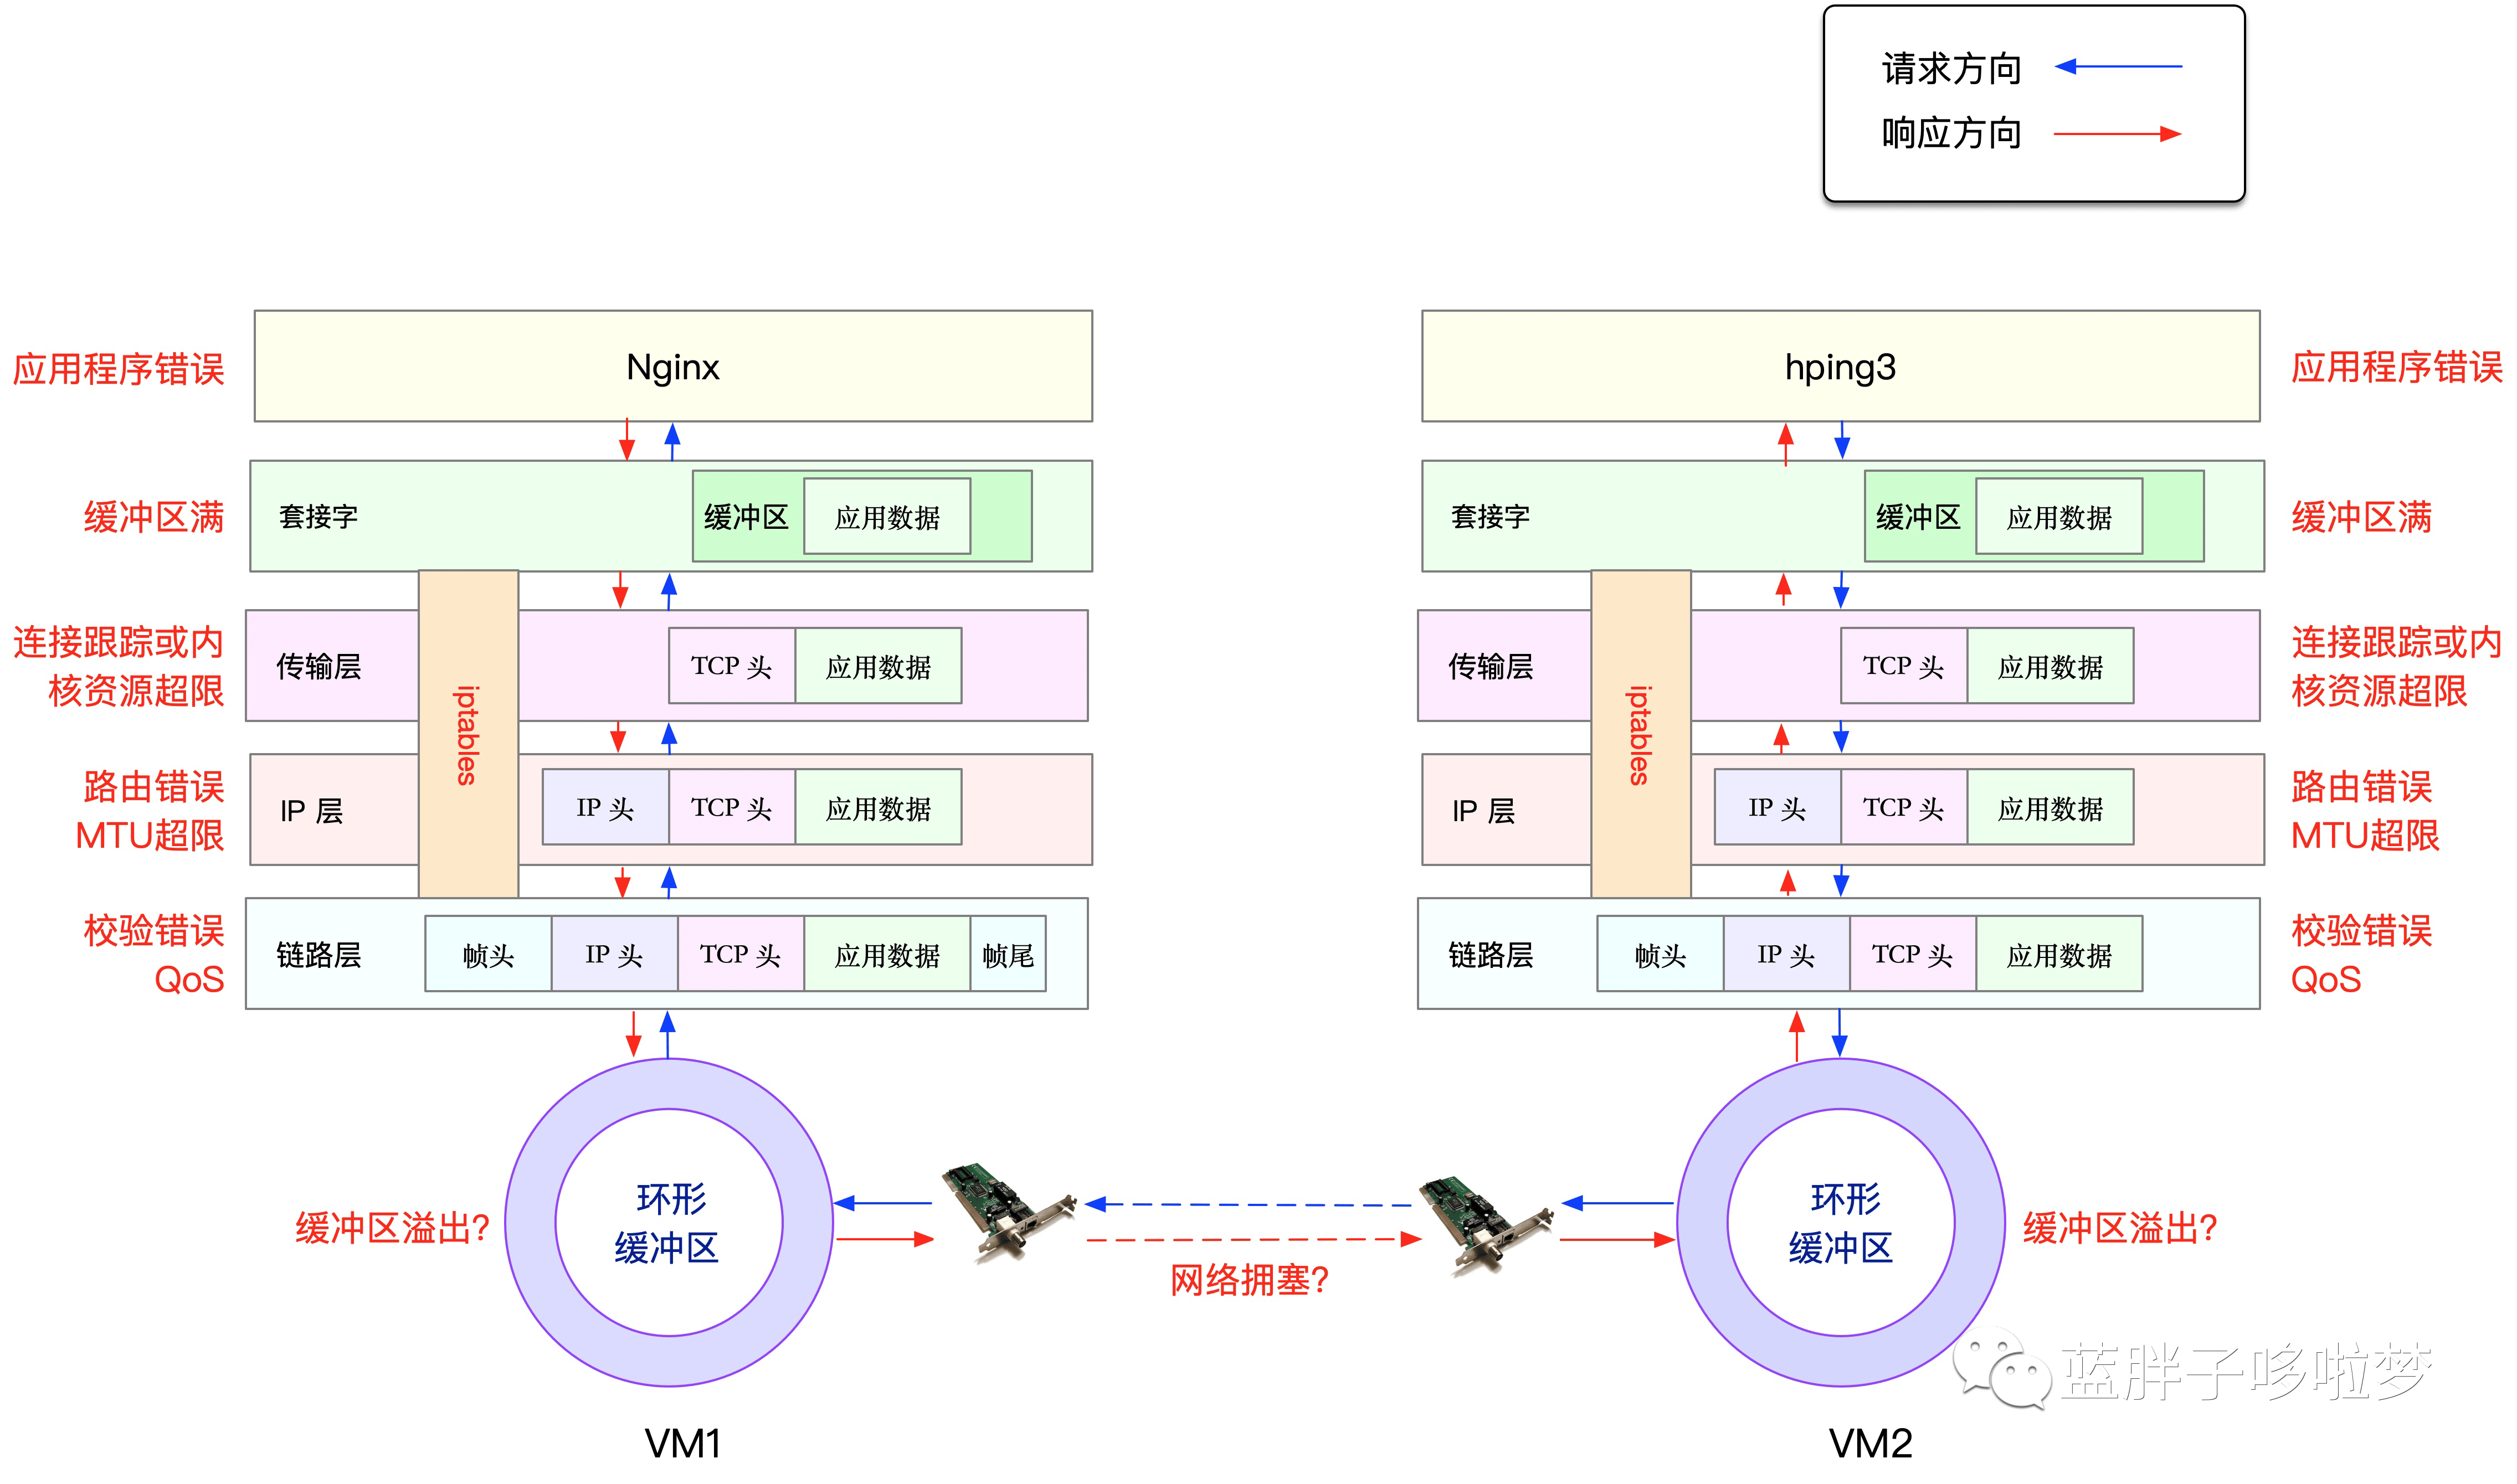
- The half-connection queue is full.
sysctl -w net.ipv4.tcp_max_syn_backlog=1024// syncookie mechanism
sysctl -w net.ipv4.tcp_syncookies=1- The full-connection queue is full.
ss -lnt
Recv-Q: current size of the full-connection queue, that is, TCP connections that have completed the three-way handshake and are waiting for the server to accept();
Send-Q: current maximum full-connection queue length. The output above indicates that the TCP service listening on port 8088 has a maximum full-connection length of 128;
cat /proc/sys/net/ipv4/tcp_abort_on_overflow- Maximum number of connections
cat /proc/sys/net/netfilter/nf_conntrack_max5. Timeout Case in Practice
I checked the timeout of <SERVICE_A>’s <API_A> API (claiming a gift pack); it was mainly because <SERVICE_B>’s <API_B> API was slow. It may be because it needs to call <DELIVERY_SYSTEM> for delivery on one hand, and the SQL is relatively complex on the other; In addition, it only provides single-item claiming and does not support batch claiming, while my side calls it concurrently. When volume becomes large, it is relatively easy to time out
Discussion
Sign in with GitHub to comment. Discussions are stored as GitHub Issues.View on GitHub