
NOTE
iostat
1. Usage By default, the output is not the current I/O state, but the state since the system started. 2. Output 3. Explanation avg cpu %user: CPU time spent in user mode, generally <60%. %nice: CPU time used by user processes whose priority has been
This is a historical learning note and may contain outdated or incomplete understanding.
1. Usage
iostat- By default, the output is not the current I/O state, but the state since the system started.
2. Output
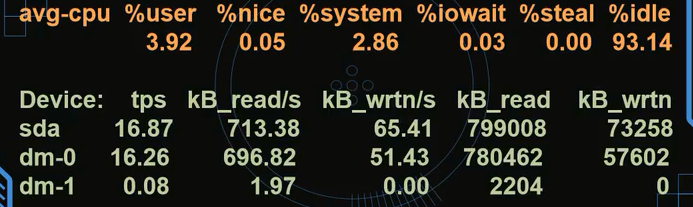
3. Explanation
- avg-cpu
- %user: CPU time spent in user mode, generally <60%.
- %nice: CPU time used by user processes whose priority has been changed.
- %system: CPU time spent by kernel processes. Generally sy+us<80%.
- %iowait: CPU time spent waiting for I/O, generally <30%.
- %steal: CPU time occupied by stolen time.
- %idle: time the CPU is idle.
- Device:
- Device: device name. You can find what it corresponds to under /dev/mapper.
-Ncan convert dm names to LVM names.
- tps: I/O transfer requests accepted by the device per second.
- kB_read/s: amount of data read by the device per second (KB).
-mcan change it to MB.
- KB_wrtn/s: amount of data written by the device per second (KB).
- KB_read: total amount of data read by the device.
- KB_wrtn: total amount of data written by the device.
- Device: device name. You can find what it corresponds to under /dev/mapper.
4. How to Determine a CPU/I/O Bottleneck
- If %idle is below 20%, the bottleneck is CPU.
- If %iowait is high while %idle is above 70%, the bottleneck is I/O.
5. How to Find an I/O Bottleneck
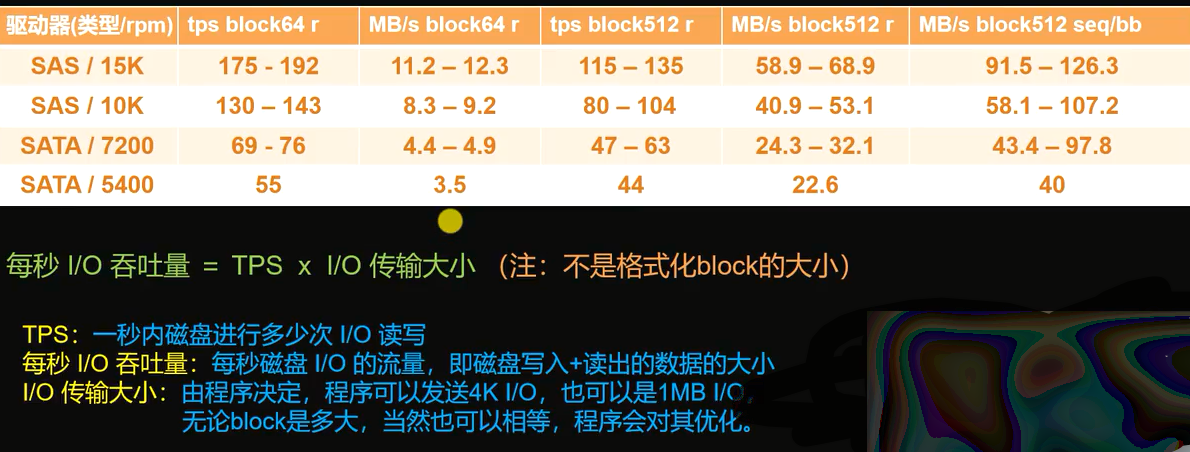
- Understand disk speed.
- Usage
# Collect statistics every 2s, 3 times in total
iostat -xdk 2 3- Result

- Explanation
- rkB/s indicates the amount of data read per second, in kB.
- wkB/s indicates the amount of data written per second, in kB.
- await: average wait time.
- SSD: around 1ms indicates a problem.
- HDD: around 8ms indicates a problem.
- util: I/O utilization.
- Indicates what percentage of one second is spent on I/O operations. When it approaches 100%, it means disk bandwidth is fully utilized and the program needs optimization or additional disks.
- Of course, because disk devices can process multiple I/O requests in parallel, even 100% does not mean the device is saturated.
Discussion
Sign in with GitHub to comment. Discussions are stored as GitHub Issues.View on GitHub