
NOTE
top
1. Usage Press h to view the help menu. View the CPU usage of a process. 2. Output 3. Explanation top 13:57:40 up 1:47, 0 users, 13:57:40: current system time; it can be obtained with date. up 1:47: how long this system has been running continuously;
This is a historical learning note and may contain outdated or incomplete understanding.
1. Usage
top-
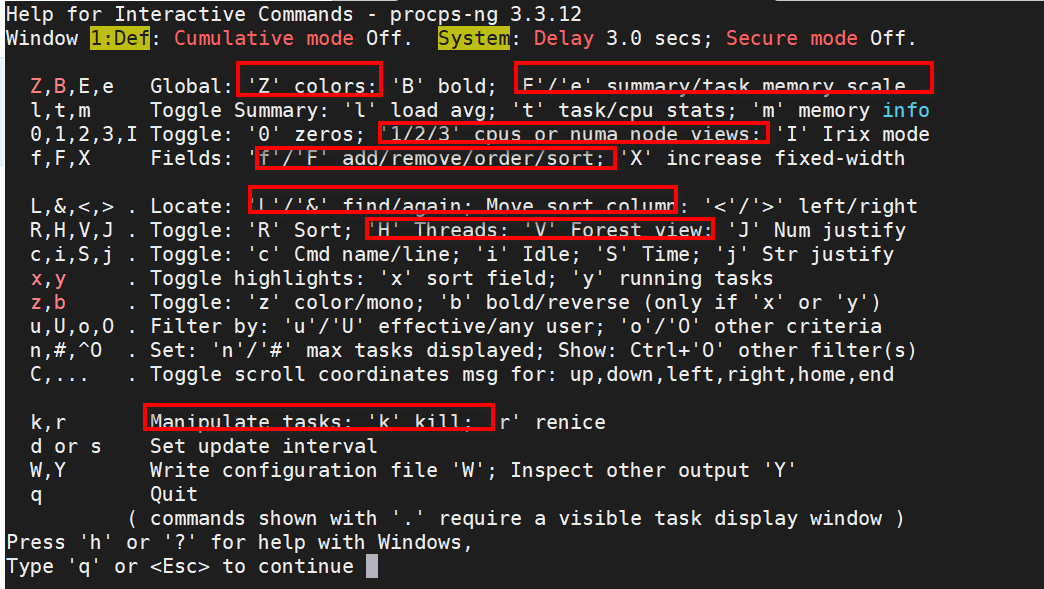
Press h to view the help menu.
-
View the CPU usage of a process.
top -p `pgrep -f webcast_gorm_encryption`2. Output
3. Explanation
top - 13:57:40 up 1:47, 0 users,- 13:57:40: current system time; it can be obtained with date.
- up 1:47: how long this system has been running continuously; last reboot can be used to obtain the system’s last reboot time.
- 0 users: number of users currently logged in to the system; it can be obtained with who.
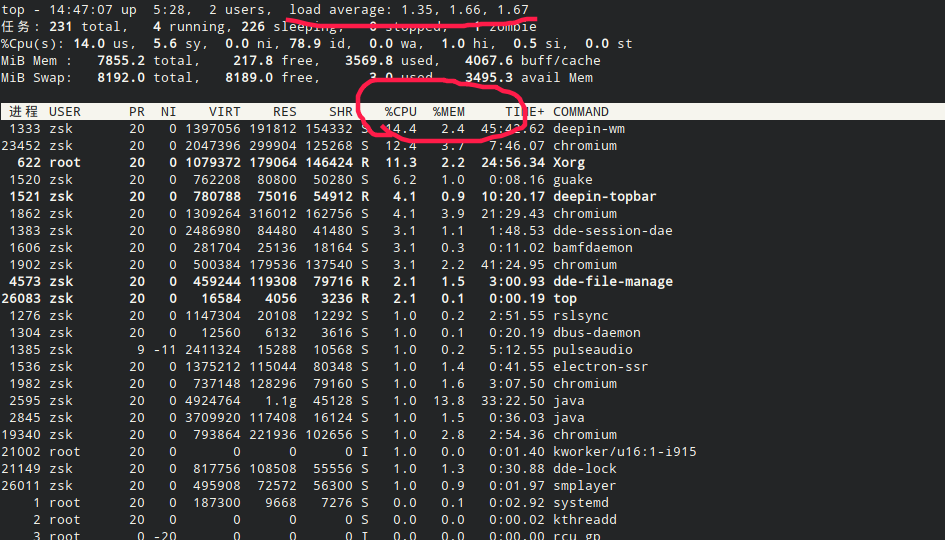
load average: 0.52, 0.58, 0.59- Average system load over the previous 1, 5, and 15 minutes.
- 0.59 means that from the current time back through the previous 15 minutes, roughly 0.59 processes (threads) were waiting for CPU resources. In other words, the CPU was idle 41% of the time.
- This value is defined for a single-core processor. For multiple cores, divide it by the number of CPU cores.
grep 'model name' /proc/cpuinfo | wc -lcan obtain the number of CPU cores.- You can also press
1under the top command to obtain the number of CPU cores.
- The load of a single core should be below 1; generally below 0.7 is considered normal.
- Average system load over the previous 1, 5, and 15 minutes.
Tasks: 17 total, 1 running, 16 sleeping, 0 stopped, 0 zombie- 17 total: there are currently 17 processes in the system.
- 1 running: there is 1 process in the running state.
- Running state: the process is running or in the run queue.
- 16 sleeping: there are 16 processes in the sleeping state.
- Sleeping state: the process is waiting for an event to complete.
- 0 stopped: there are 16 processes in the stopped state.
- Stopped state: the process received a STOP signal.
- 0 zombie: there are 16 processes in the zombie state.
- Zombie state: if a child process exits while the parent process continues running but does not obtain the child process’s exit status, the child process is in the zombie state.
%Cpu(s): 2.1 us, 2.7 sy, 0.0 ni, 94.3 id, 0.0 wa, 0.9 hi, 0.0 si, 0.0 st- %Cpu(s): CPU state, shown as percentages.
- 2.1 us: CPU time spent in user mode. Generally <60%.
- 2.7 sy: CPU time spent by kernel processes. Generally sy+us<80%.
- 0.0 ni: CPU time used by user processes whose priority has been changed.
- 94.3 id: time the CPU is in the interrupted (idle) state.
- 0.0 wa: CPU time spent waiting for I/O. Generally <30%.
- 0.9 hi: CPU used by hardware interrupts.
- 0.0 si: CPU used by software interrupts.
- 0.0 st: CPU used by stolen time.
KiB Mem : 25010324 total, 16740476 free, 8040496 used, 229352 buff/cache- KiB Mem: memory information.
- 25010324 total: the system has a total of 25010324KB of memory.
- 16740476 free: 16740476KB of memory is free.
- 8040496 used: 8040496KB of memory is occupied by programs.
- 229352 buff/cache: 229352KB of memory is occupied by disk swapping or cache.
KiB Swap: 62434556 total, 62434556 free, 0 used. 16836096 avail Mem- KiB Swap: swap information.
- 62434556 total: the system has a total of 62434556KB of swap space.
- 62434556 free: 62434556KB of swap space is free.
- 0 used: 0KB of swap space is used.
- 16836096 avail Mem: indicates 16836096KB of physical memory available for the next process allocation.
PID USER PR NI VIRT RES SHR S %CPU %MEM TIME+ COMMAND- PID: process ID.
- USER: username of the process owner.
- PR: task priority; lower means higher priority.
- NI: nice value. A smaller value means higher priority; a larger value means lower priority.
- VIRT: total virtual memory used by the process, in KB. VIRT=SWAP+RES.
- RES: physical memory used by the process that has not been swapped out, in KB. RES=CODE+DATA.
- SHR: shared memory size, in KB.
- S: process state.
- D = uninterruptible sleep.
- R = running.
- S = sleeping.
- T = traced / stopped.
- Z = zombie process. Process
- %CPU: percentage of CPU time used since the last update.
- TIME+: total CPU time used by the process, accurate to 1/100 second.
- COMMAND: command name / command line.
Discussion
Sign in with GitHub to comment. Discussions are stored as GitHub Issues.View on GitHub