
NOTE
Flame Graph
1. perf Command It is a performance analysis tool natively provided by Linux. It returns the function name currently being executed by the CPU and the call stack (stack). 1.1. Usage perf record means record. F 99 means 99 times per second. If all 99
This is a historical learning note and may contain outdated or incomplete understanding.
1. perf Command
It is a performance-analysis tool natively provided by Linux. It returns the function name currently being executed by the CPU and the call stack (stack).
1.1. Usage
sudo perf record -F 99 -p 13204 -g -- sleep 30- perf record means record.
-F 99means 99 times per second. If all 99 samples return the same function name, it means the CPU spent this entire second executing the same function, which may indicate a performance problem.-p 13204is the process ID, meaning which process to analyze.-gmeans record the call stack.sleep 30means continue for 30 seconds.
2. Flame Graph
2.1. Why It Exists
Because perf results have poor readability, flame graphs were introduced.
3. What Is a Flame Graph?
A flame graph is an SVG image generated from perf results and is used to display the CPU call stack.
3.1. Example
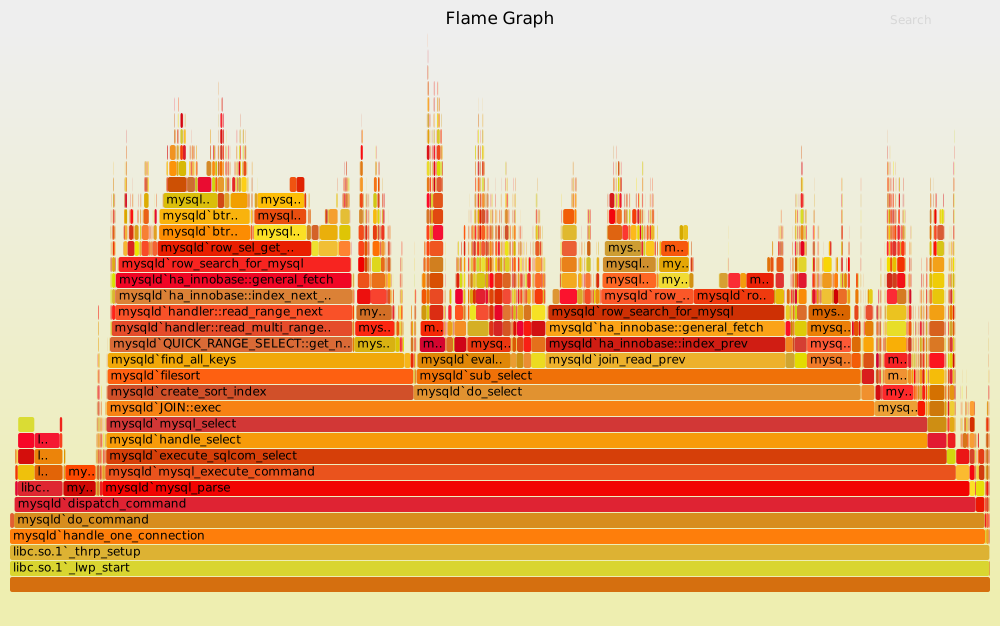
- The y-axis represents the call stack, with each layer being a function. The deeper the call stack, the taller the flame. The top is the currently executing function, and the functions below are its parent functions.
- The x-axis represents the number of samples. The wider a function is on the x-axis, the more often it was sampled, meaning it executed for longer. Note that the x-axis does not represent time; all call stacks are merged and then arranged alphabetically.
- Interaction
- Hovering the mouse displays the full function name, the number of samples, and the percentage of total samples it occupies.
- Clicking a layer horizontally enlarges the flame graph so that the layer occupies the full width and shows detailed information.
- Pressing Ctrl + F displays a search box. The user can enter a keyword or regular expression, and all matching function names are highlighted.
Discussion
Sign in with GitHub to comment. Discussions are stored as GitHub Issues.View on GitHub