
NOTE
How China's Economy Runs
English translation of the original VNote “中国经济是怎么run起来的”, preserving its structure with only necessary small corrections.
This is a historical learning note and may contain outdated or incomplete understanding.
1. Preface
Since reform and opening up, China has achieved remarkable economic growth.
For historical GDP growth rates, see GDP Annual Growth Rate (Indicator).
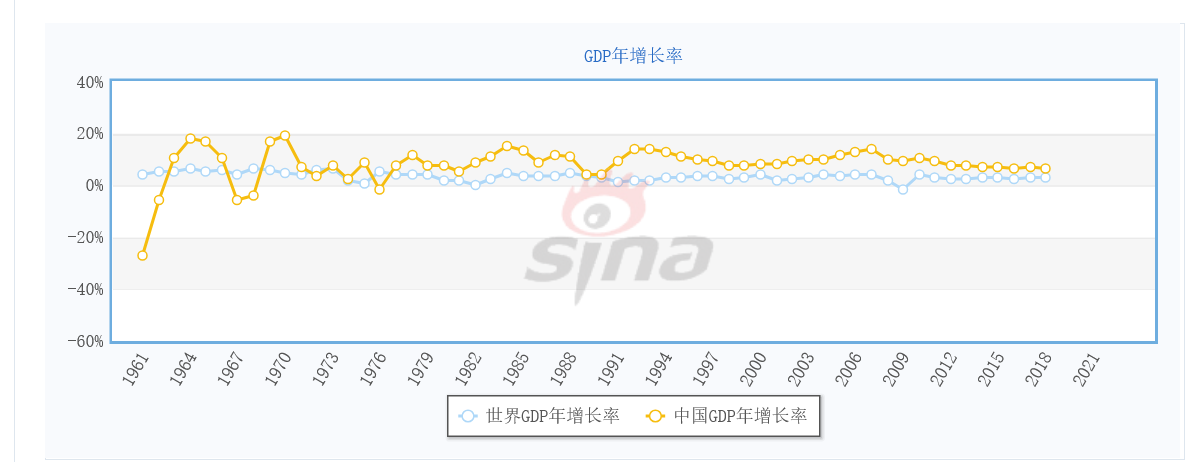
From 1978 to 2005, China’s GDP grew at an average annual rate in the double digits. This was unusual, but not unprecedented, given earlier “East Asian miracles” such as Japan, South Korea, and Singapore. After 2005, despite various domestic and external challenges, China’s GDP still averaged single-digit annual growth—the so-called “new normal”—which is relatively uncommon.
On the one hand, I sincerely feel proud of what my country has achieved. On the other hand, I also feel a little embarrassed that my own salary growth has lagged far behind national GDP growth. That led to a small question in my mind: why has China’s economy been able to sustain such rapid growth? Can it continue doing so in the future? What can I do to keep up with China’s development and ride the wave for a while? Driven by that curiosity, I wanted to explore how China’s economy gets itself running.
Because this is an extremely broad topic, and because my own knowledge and energy are limited, many parts of the logic in this note may not withstand close scrutiny. It is mainly an attempt to connect what I have learned and record my own understanding and thoughts.
2. Starting with Western Economics
2.1. A Brief History of Economics
As a social science, economics necessarily develops alongside changes in society. So it makes sense to learn economics from a historical perspective.
Original VNote image is not available in the public repository:
_v_images/20240918150027782_31246.png
For a reference, see Economics - Wikipedia. Roughly speaking:
- Early stages
- Mercantilism: From the 16th to the 18th century, mercantilist ideas were influential among some merchants and politicians. They held that national wealth came from accumulating gold and silver, and that countries without natural gold or silver resources had to accumulate them by exporting goods while restricting imports other than raw materials. Mercantilists favored importing cheap raw materials for export production and using tariffs to protect domestic producers from foreign competition.
- Physiocracy: In 18th-century France, the Physiocrats viewed the economy as a circular flow of income and output. They argued that only agriculture produced a surplus above cost and was therefore the foundation of all industries. They opposed mercantilism’s emphasis on manufacturing and exports at the expense of agriculture. They also favored replacing costly tax-collection systems with taxes on landowners’ income. Compared with mercantilists, they were more supportive of laissez-faire policies and less government intervention.
- Classical economics
- Adam Smith’s 1776 book The Wealth of Nations is commonly regarded as an important starting point of modern economics. It treated land, labor, and capital as important factors of production and sources of national wealth, moving beyond the Physiocratic claim that only agriculture was productive.
- Marxian economics developed out of classical economics. Karl Marx developed its basic theoretical framework. In Capital, first published in 1867, Marx built on the labor theory of value and argued that capitalist production generates surplus value, which he interpreted as exploitation of labor by capital. Under the labor theory of value, the value of a product is determined by the socially necessary labor required for its production; the theory of surplus value argues that wages compensate labor power only for the portion needed to reproduce that labor power.
- The marginal revolution
- Between roughly 1870 and 1910, economists including William Stanley Jevons in England, Carl Menger in Austria, and Léon Walras in Switzerland challenged assumptions of classical economics. This change became known as the “marginal revolution.” Marginalism rejected the classical labor theory of value and argued that value depends on marginal utility rather than labor alone. It helped explain puzzles such as the diamond-water paradox and contributed to the subjective theory of value that became part of the foundation of modern neoclassical economics.
- Keynesianism
- Keynesian economics grew out of John Maynard Keynes’s 1936 book The General Theory of Employment, Interest and Money, which helped establish macroeconomics as a distinct field.
- Neoclassical economics
2.2. What Does Economics Study?
The British economist Lionel Robbins, a prominent member of the London School of Economics, proposed in 1932:
Economics is the science that studies how people make choices under limited resources.
My understanding is:
- Resources are limited while human wants are effectively unlimited. It is impossible to satisfy unlimited wants with limited resources, so choices must be made about what to produce, how to produce it, and for whom to produce it. These are the classic questions of resource allocation.
- One goal of resource allocation is efficiency. Economics has a concept called “Pareto efficiency.” An allocation is Pareto efficient when it is no longer possible to improve one person’s welfare without reducing someone else’s welfare.
- Two major ways of allocating resources are planned economies and market economies. In the former, planning authorities make allocation decisions; in the latter, the so-called “invisible hand” operates largely through the price mechanism.
So economics studies how limited resources can be allocated to satisfy human wants as efficiently as possible—from an individual choosing purchases under a limited income to a country trying to grow faster with limited resources.
2.3. Microeconomics
Microeconomics focuses on individual participants in economic activity. It commonly starts with the simplifying assumption that people are rational actors who seek to maximize their own objectives under given constraints. It then broadly classifies participants into consumers and producers and studies their behavior separately.
- Consumers: residents and households, for example. Under the rational-actor assumption, they make purchases in pursuit of maximum satisfaction.
- Producers: firms and businesses, for example. Under the rational-actor assumption, they make production decisions in pursuit of maximum profit.
Goods—products and services—connect purchasing and production. How do we measure their scarcity? Through prices. This is one of the central concerns of microeconomics.
2.3.1. What Determines the Price of a Good?
What determines price has long been controversial in the history of economics. Alfred Marshall’s Principles of Economics, published in 1890, helped synthesize several of the competing approaches.
- Objective-side explanations
- Labor determines value
- Labor + capital determine value
- Labor + capital + land determine value
- Subjective-side explanations
- Marginal utility
- Supply (including labor, capital, and land) and demand (including marginal utility)
2.3.1.1. Demand and Supply
You can supposedly turn a parrot into a trained economist by teaching it just two words: “supply” and “demand.”
This classic economics joke illustrates the importance of supply-and-demand analysis. It helps us understand prices.
2.3.1.1.1. Demand
First, what is demand?
Demand is the quantity of a good that consumers are both willing and able to buy at a given price level during a given period.
- Willing to buy: desire
- Able to buy: purchasing power—actual money
- Demand = desire + purchasing power
- Desire alone is potential demand
- Both together form effective demand
- Distinguishing potential from effective demand helps us understand actual market demand. A country may have a large population but lower effective demand, while a smaller country may have higher effective demand.
Second, what affects demand?
- The good’s own price
- In general, when price rises, quantity demanded falls.
- Income
- If income rises and demand rises, it is a normal good; if income rises and demand falls, it is an inferior good.
- Preferences
- The stronger the preference, the higher the demand.
- Prices of related goods
- If the price of good A rises and demand for B falls: complements -> firms may have a cooperative relationship.
- If the price of A rises and demand for B rises: substitutes -> firms may have a competitive relationship.
- If the price of A rises and demand for B is unchanged: independent goods.
- Expectations about the future
- Better expectations -> demand rises.
- Worse expectations -> demand falls.
Third, how can we describe and quantify how these factors affect demand?
- Demand curve
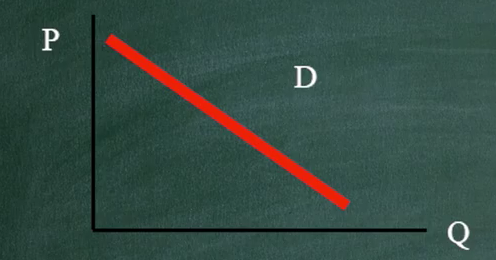
- It shows the quantity consumers demand over a given period.
- Change in quantity demanded: a movement caused by a change in the good’s own price.
- Change in demand: a shift caused by non-price factors.
2.3.1.1.2. Supply
First, what is supply?
Supply is the quantity of a good that producers are both willing and able to provide at a given price level during a given period.
- Willing to sell: willingness to sell, related to price
- Able to sell: production capacity/output
- Supply = willingness to sell + output -> price + output
- When both conditions are satisfied, there is effective supply; when only one is satisfied, there is potential supply.
- Distinguishing effective from potential supply helps us understand producers’ realized sales and income.
Second, what affects supply?
- The good’s own price
- Higher price -> higher output.
- Production cost
- Higher cost -> lower output.
- Technology
- Better technology -> higher output.
- Productivity = (labor + capital + land) * technology
- Prices of related goods
- A change in related-goods prices can change the quantity producers choose to supply.
- Expectations
- Better economic expectations may encourage higher output.
Third, how can we describe and quantify these effects?
- Supply curve
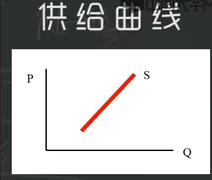
- It shows the quantity producers supply over a given period.
- Change in quantity supplied: a movement caused by a change in the good’s own price.
- Change in supply: a shift caused by non-price factors.
2.3.1.1.3. How Do Demand and Supply Determine Price?
Because market demand is the sum of individual demand, market demand follows the law of demand. Because market supply is the sum of individual supply, market supply follows the law of supply.
Together, demand and supply determine the market price.
- A market can broadly be in three states:
- Excess supply
- Equilibrium
- When quantity demanded equals quantity supplied, the market is in equilibrium. The corresponding price is the equilibrium price and the corresponding quantity is the equilibrium quantity.
- Excess demand
2.3.1.2. Marginal Utility
“Marginal” means looking at the effect of one additional unit.
- Consumer behavior: diminishing marginal utility. If you keep buying the same thing, eventually an additional unit can provide little or no extra utility. When purchasing multiple goods, the basic optimization idea is to allocate spending so that the last unit of money spent on each good provides comparable marginal utility.
- Producer behavior: diminishing marginal product. If producing a good requires several inputs and all but one are held constant, continually increasing that one input will eventually add less and less output. The corresponding optimization idea is to allocate spending across inputs according to the marginal product generated by the last unit of money spent on each input.
2.4. Macroeconomics
One way to understand the historical emergence of macroeconomics is that the price mechanism—the core of the “invisible hand”—does not always stabilize the economy on its own. Macroeconomics tries to understand such failures and how fiscal and monetary policy can respond.
If microeconomics studies the behavior of individual consumers and producers, macroeconomics studies the behavior of the economy formed by all those individuals. Two major topics are economic growth and business cycles.
Over the long run, an economy’s national income tends to grow—economic growth. Over shorter periods, economic activity fluctuates. High activity may be described as overheating and low activity as recession; repeated fluctuations form the business cycle.
2.4.1. How Do We Measure the Condition of an Economy?
2.4.1.1. GDP
Measuring an economy requires macroeconomic statistics. Historically, the Soviet Union and other planned economies used the Material Product System (MPS), which focused mainly on material-production sectors. Modern economies widely use the System of National Accounts (SNA), in which GDP and related measures capture value added across economic activity, including services.
First, what is GDP?
GDP is the market value of all final goods and services produced within an economy’s territory during a given period.
- Given period: a flow, not a stock
- Final goods and services: goods and services for final use rather than intermediate production
- Market value: value measured using prices
Second, how is GDP calculated?
There are three approaches whose results should, in principle, be consistent: the production approach, income approach, and expenditure approach. Statistical systems may emphasize them differently in publication.
- Production approach: sum value added across industries.
- Expenditure approach: sum consumption, investment, government purchases, and net exports.
- Income approach: sum labor compensation, capital income, and relevant production-related taxes and other income generated in production.
Formula: GDP = C + I + G + (X - M), meaning gross domestic product = consumption + investment + government purchases + (exports - imports). In China’s expenditure-side accounts, it is commonly presented as final consumption expenditure + gross capital formation + net exports of goods and services. Government consumption is included in final consumption expenditure. These are often described as the “three engines”: consumption, investment, and net exports.
2.4.2. Short-Run Growth and Aggregate Demand
2.4.2.1. Aggregate Demand
Consider the Great Depression that swept through capitalist economies beginning in 1929:
-
Problem: goods could not be sold.
-
Cause:
Keynes argued that insufficient spending was a central problem. Reasons people and firms might not spend included:
- Diminishing marginal utility of consumption
- Declining marginal efficiency of capital
- Liquidity preference
- Response:
If households and firms are unwilling to spend enough, another sector can spend: government. In a deficit-financed fiscal expansion, the government can issue bonds and borrow to purchase goods and services.
2.4.2.2. Government and Fiscal Policy
First, what is fiscal policy?
Fiscal policy consists of government measures that use taxation, public spending, and borrowing to influence aggregate demand and economic activity.
Second, what tools does fiscal policy use?
- Revenue and financing measures: taxes and public-debt issuance, including central- and local-government bonds.
- Expenditure measures: government spending
- Purchases: spending in exchange for actual goods or services, such as military supplies, government-office supplies, compensation of government employees, and public works.
- Transfer payments: spending without receiving a current good or service in return, such as social-insurance benefits, poverty relief, and subsidies.
Third, how can fiscal policy affect aggregate demand?
- When aggregate demand is insufficient, use expansionary policy:
- Revenue side: cut taxes.
- Expenditure side: increase government purchases.
- When aggregate demand is overheating, use contractionary policy:
- Revenue side: raise taxes.
- Expenditure side: reduce government purchases.
2.4.2.3. Central Banks and Monetary Policy
First, what is monetary policy?
Monetary policy consists of measures taken by a central bank to influence money, credit, interest rates, and financial conditions.
Second, money demand and money supply.
Third, what tools can monetary policy use?
- Reserve requirements: commercial banks may be required to hold a specified proportion of deposits as reserves.
- Discount or lending rates: interest rates charged when commercial banks borrow from the central bank.
- Open-market operations: central-bank purchases and sales of securities in the secondary market.
Fourth, how can monetary policy influence aggregate demand?
- When aggregate demand is insufficient, expansionary policy may include:
- Lowering reserve requirements
- Lowering relevant policy/lending rates
- Buying securities and injecting liquidity
- When aggregate demand is overheating, contractionary policy may include:
- Raising reserve requirements
- Raising relevant policy/lending rates
- Selling securities or otherwise withdrawing liquidity
This is the territory behind phrases such as central-bank liquidity injections, balance-sheet expansion and contraction, and rate hikes. It also touches on a basic accounting concept: the balance sheet.
Quantitative tightening: A central bank can shrink its balance sheet by allowing assets to mature without full reinvestment, reducing reinvestment, or directly selling some assets. This tightens financial conditions and is often described as “balance-sheet normalization.”
- Balance sheets
- Federal Reserve: assets include Treasury securities and other holdings; liabilities include currency, bank reserves, the Treasury General Account, and other accounts.
- U.S. Treasury: it holds a cash balance in its Treasury General Account (TGA) at the Federal Reserve and issues Treasury securities as liabilities.
- Banks: assets include reserves and securities; liabilities include deposits owed to the public.
- Public: households and firms can hold Treasury securities and bank deposits as assets, but generally cannot hold reserve balances directly at the Federal Reserve.
2.4.3. What Determines Long-Run Economic Growth?
- Direct causes
- Factors of production: labor and capital
- Technology
- Deeper causes
- Natural resources
- Culture
- Institutions
2.4.4. Business Cycles
First, phases often discussed in business-cycle analysis include recession, recovery, overheating/boom, and sometimes stagflation.
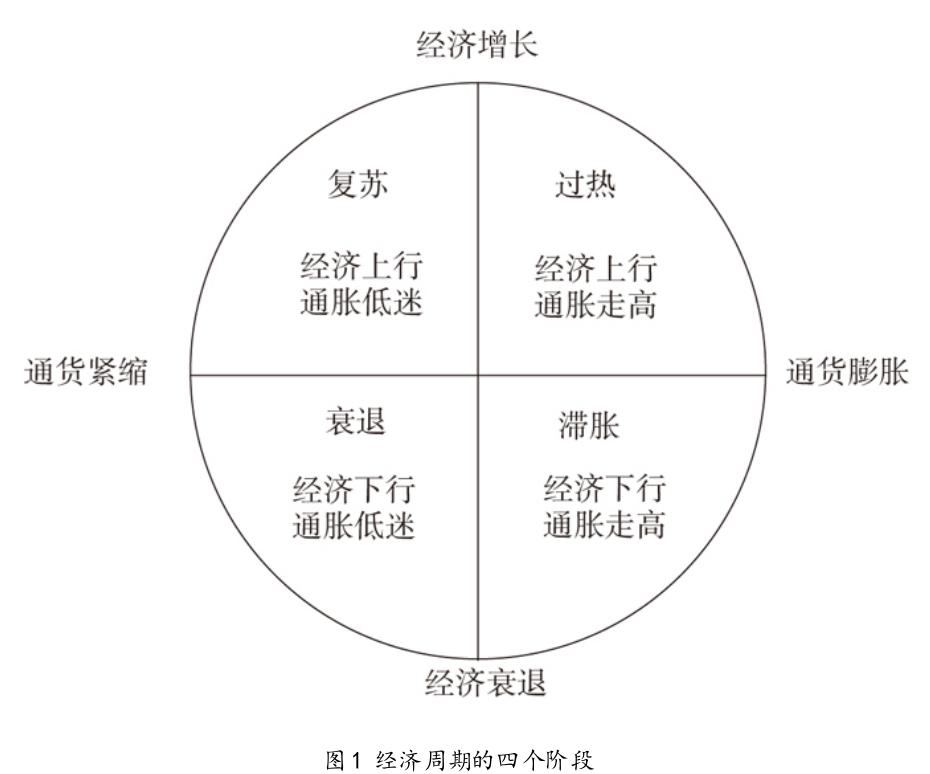
Second, how do we identify the business cycle?
It is hard to identify the current phase reliably in real time. That is why I think the well-known Merrill Lynch Investment Clock can look like hindsight: it maps different economic phases to different asset classes.
- Recession: bonds and cash
- Recovery: stocks and bonds
- Overheating: commodities and stocks
- Stagflation: cash and commodities
2.4.4.1. Unemployment
First, what is unemployment?
It generally refers to people of working age who are willing and available to work at prevailing conditions, do not have a job, and are actively seeking one.
Second, why does unemployment occur?
- Frictional unemployment: suppose you worked in Guangzhou and decide to move to Shanghai. You may not have a new job immediately, so you spend some time searching. During that interval, you are frictionally unemployed.
- Structural unemployment: suppose a group of workers made kerosene lamps, but electric lighting makes that product obsolete. Society may now need workers in electric-light production, but former kerosene-lamp workers cannot instantly switch occupations. The mismatch between available workers and the skills or locations demanded by employers creates structural unemployment.
Frictional and structural unemployment are commonly treated as components of the natural rate of unemployment. An economy can be described as being at “full employment” even though some such unemployment remains.
- A third category is cyclical unemployment, caused by recession or the business cycle. When aggregate demand collapses, firms cannot sell enough goods, cut production, and lay off workers.
Third, how can unemployment be reduced?
Better education, reduced information gaps, and better job-market information can help. Over the long run, sustained economic growth and labor-market adaptation are central.
2.4.4.2. Inflation
First, what is inflation?
A rise in the general price level. A commonly used measure is the CPI, the Consumer Price Index.
How is CPI calculated? A national statistical agency—for example, China’s National Bureau of Statistics—selects a representative basket of consumer goods and services, tracks their price changes, and applies expenditure weights based on household consumption patterns.
For a simplified example, suppose the basket costs 10,000 yuan in a 2023 base period, giving an index of 100. If the same basket costs 20,000 yuan in 2024, then CPI would be 20,000 / 10,000 * 100 = 200, and the inflation rate would be (200 - 100) / 100 * 100% = 100%.
Second, what causes inflation?
Milton Friedman famously emphasized that sustained inflation is ultimately closely related to monetary factors.
Monetary policy is mainly conducted by central banks.
Third, how can inflation be controlled?
Macroeconomic policy generally aims for low and stable inflation, avoiding both persistent high inflation and deflation:
- Low and stable inflation can reduce some frictions in adjusting prices and wages.
- Inflation changes the real burden borne by creditors, debtors, and governments, and can create redistribution effects sometimes described as an “inflation tax.” Policies such as quantitative easing can also create international spillovers through financial markets, capital flows, and exchange rates.
Unemployment and inflation may show a short-run trade-off in some periods, but the relationship is not a fixed inverse one. When an economy overheats and inflation pressure becomes excessive, contractionary monetary and fiscal policy can be used.
During a slump, see Unemployment. During overheating, see Inflation.
2.5. Finance
2.5.1. What Is Finance?
At a basic level, finance is the movement of funds—in plain terms, borrowing and lending between lenders and borrowers.
Lenders want money to generate more money through interest or returns. Borrowers want to purchase or invest in things they cannot currently finance out of pocket.
2.5.2. How Finance Affects the Economy
2.5.2.1. The Business Cycle
-
Borrowing can increase spending and the number of transactions, supporting an economic upswing.
-
A strong upswing can generate inflation pressure. If interest rates rise, borrowers may become less willing to borrow, transaction volume can fall, and economic activity can weaken.
2.5.2.2. Debt
2.5.2.2.1. Why Can Excessive Debt Contribute to an Economic Crisis?
- In highly leveraged economies, declines in asset prices can be rapid.
- Falling asset prices can trigger tighter credit conditions and break funding chains.
2.5.2.2.2. Why Does Debt Keep Growing?
Demand for borrowing:
- Firms: before receiving revenue, they may need to build factories, buy equipment, and pay wages, so they borrow from banks.
- Households: buying homes.
- Governments: infrastructure investment.
Supply of credit: Why might banks lend aggressively? One factor can be financial deregulation or looser credit constraints.
2.5.2.2.3. Short-Term Debt
Short-term debt conditions are strongly influenced by interest rates and credit conditions.
2.5.2.2.4. Long-Term Debt
Upswing: leverage can contribute to asset bubbles, eventually creating pressure to deleverage. Downturn: economic activity weakens and policy rates may already be very low, leaving less room for conventional rate cuts. What can be done?
- Cut spending. This reduces transactions and someone else’s income, which can make existing debt burdens harder to service.
- Reduce debt through restructuring or default. Losses are then borne by creditors and can damage bank balance sheets.
- Redistribute income and wealth. Taxes and transfers can shift resources between groups, though poorly handled redistribution can also intensify social conflict.
- Expand central-bank money and credit support. For example, a central bank can purchase bonds, easing financing conditions and helping the government run deficits that support spending through stimulus programs or unemployment benefits.
3. How an Economy Runs from the Perspective of Western Economics
This section summarizes the previous chapter and connects the pieces into a simple picture of how an economy operates.
Related original VNote: “How the Economy Works” (not yet published).
From a microeconomic perspective, the basic activity is buying and selling between consumers and producers.
4. How Does China’s Economy Run?
Related original VNote: “China’s Economy” (not yet published).
5. The Government in China’s Socialist Market Economy
5.1. Why Studying China’s Economy Requires Studying Government
In the conventional textbook sense, government provides public services, but the role of government in China’s economy goes much further.
Take investment attraction as an example. Economic development requires firms, and many inputs firms need—land, finance, subsidies, and labor—are strongly affected by government policy.
- Land: urban land is publicly owned. Local governments can supply industrial land, often on favorable terms, and carry out land preparation and supporting infrastructure.
- Finance: governments may help firms obtain financing through various channels.
- Labor: governments may use talent-attraction and related policies.
5.2. What Is Government?
China’s administrative system consists of the central government and local governments. Local governments are organized across provincial, prefecture/city, county/district, and township levels. Local governments operate within the broader central system, while the country’s size and diversity also make local administration essential.
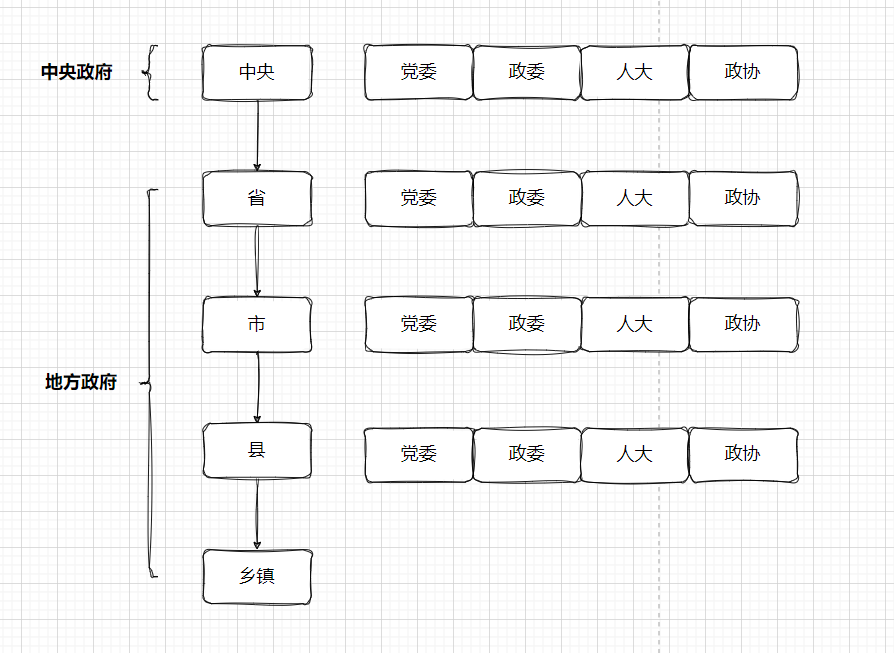
In functional terms, for example, the central level has the Ministry of Finance, provinces have finance departments, and cities have finance bureaus.
The commonly used phrase “four leadership bodies” refers to the Party committee, people’s congress, government, and CPPCC committee. Corresponding organizations exist at provincial, municipal, and county levels and perform different functions.
5.3. Government Responsibilities
The bureaucratic system described above is complex. A workable political-administrative system has to balance central and local authority while maintaining decision-making efficiency. This leads to the question of government responsibilities.
5.3.1. What Are Government Responsibilities?
They describe which level of government has authority and responsibility to perform which tasks. What a government is responsible for also affects which resources it needs.
How should we decide whether a matter belongs primarily to the central government or to local government?
5.3.2. How Are Responsibility Boundaries Divided?
Three useful principles are economies of scale in public services, information complexity, and incentive compatibility.
- Externalities and economies of scale in public services
A core government function is providing public goods and public services. When a service can be shared by more people, its per-person cost may fall—an economy of scale. That logic might suggest larger administrative areas, but larger populations can also make services harder to tailor and administer, so scale cannot increase without limit.
- Information complexity
Higher levels supervise lower levels and may formally have authority to overturn lower-level decisions, but local governments often possess better local information. Decentralization can therefore improve decisions. At the same time, supervision, auditing, and accountability mechanisms are needed to reduce information concealment and agency problems.
- Incentive compatibility
If one level of government wants a task done and another level both wants and is able to do it well, their incentives are compatible. In reality, different levels may have different objectives and capabilities, so institutions are needed to align incentives and responsibilities.
5.4. Fiscal Authority
5.4.1. What Is Fiscal Authority?
Doing things costs money. Government responsibilities therefore require corresponding fiscal resources. The more difficult question is which level of government should have the authority to raise which revenues.
Tensions between spending responsibilities and revenue authority led to a series of fiscal reforms.
5.4.2. Fiscal Reform
5.4.2.1. Fiscal Contracting
1989-1993
“Contracting” here means keeping ownership arrangements unchanged while contracting out use or operating rights in order to strengthen incentives.
Under the fiscal-contracting system, local governments retained much of the revenue left after fulfilling their remittance obligations to the central government. This created strong incentives for local economic development and was associated with rapid local growth.
5.4.2.1.1. Effects
Benefit: local governments had strong incentives to develop their economies, and township and village enterprises expanded rapidly.
Problem: the central government’s share of total budgetary revenue declined, while total budgetary revenue as a share of GDP also fell. The central government therefore sought fiscal reform.
5.4.2.2. The Tax-Sharing Reform
1994
Taxes were divided into central taxes, local taxes, and shared taxes. Shared taxes became particularly important because their revenue is divided between central and local governments.
Using value-added tax as a historical example, VAT had previously been largely local revenue. Under the 1994 arrangement, 75% went to the central government and 25% to local governments, substantially changing local revenue.
Corporate income tax was also reorganized. Revenue had previously depended partly on enterprise affiliation. Later reforms moved toward a central-local sharing arrangement, changing the fiscal distribution between levels of government.
5.4.2.2.1. Effects
Benefit: central fiscal capacity strengthened.
Problem: local governments faced tighter revenue constraints relative to their expenditure responsibilities.
- Fiscal pressure at the grassroots level
After the tax-sharing reform, the central government used transfers to help balance fiscal capacity across provinces. But funds then had to pass through provincial, city, county/district, and township levels. Lower levels often had many implementation responsibilities while having more limited revenue sources, producing grassroots fiscal pressure.
Local governments sought additional revenue to maintain operations, and some burdens fell on rural residents, contributing to tensions around the “three rural issues”—agriculture, rural areas, and farmers.
Reform of agricultural taxes and fees began around 2000, and the agricultural tax was abolished in 2006. This further changed grassroots revenue structures, after which higher-level transfers became more important.
- Uneven regional development
Central-to-local transfers can broadly include general transfers and earmarked/special transfers. General transfers can help equalize fiscal capacity across regions. Special transfers fund particular purposes or projects. Because stronger regions may have more qualifying projects and implementation capacity, the design of special transfers can sometimes interact with regional inequality.
5.4.2.3. Land Finance
Local governments still wanted to develop their economies while facing tighter fiscal constraints, so they looked for other sources of funding. One approach was to expand the economic base through investment attraction; another was to rely more heavily on land-related revenue.
Why did land become such an important source?
First, after the tax-sharing reform, local governments retained substantial authority over state-owned land conveyance and the associated revenue.
Second, two changes around 1998 mattered: welfare-based housing allocation by work units ended, and conversion of rural land into urban construction land generally required expropriation and conversion into state-owned land. These changes increased the economic importance of urban land.
Third, tender, auction, and listing mechanisms for land conveyance expanded in the early 2000s. Local governments increasingly acquired rural land and conveyed construction-land use rights for compensation, and land-related fiscal revenue grew.
5.4.2.3.1. What Is It?
Land-conveyance revenue + taxes and fees related to land use and development.
The basic logic is closely linked to real estate. At the beginning, a local government conveys industrial land-use rights and spends on site preparation and infrastructure. Revenue and costs may roughly offset each other. But once industrial and commercial activity arrives, population is attracted to the area. People who want to settle need housing, increasing residential demand. If residential land supply remains constrained, housing and land prices can rise.
In simplified terms, local governments balance industrial and residential/commercial land supply: one side supports industrialization and manufacturing, while the other supports urbanization. Revenue from land-use-right conveyance can then function as an important supplementary fiscal source.
5.4.2.3.2. Effects
Benefits:
- Rapid industrialization and urbanization.
Problems:
- Local-government debt can rise.
- Construction-land quotas historically were not fully transferable across provinces. Fast-growing places receiving large population inflows could therefore face shortages of construction-land quota even when physically available land existed.
5.4.2.3.3. Why Did the Land-Finance Model Become Harder to Sustain?
The stage of economic development changed, while simply converting more land no longer produced the same productivity gains.
Early stage: converting agricultural land into industrial and commercial land could shift activity from lower-productivity agriculture toward higher-productivity industry and services.
Later stage: land alone is not enough. Productivity increasingly depends on technology, human capital, institutions, and other factors.
5.5. Land-Based Finance
5.5.1. What Is Land-Based Finance?
Finance, in simple terms, means borrowing and repaying, backed by assets and credit.
Land-based finance uses land and expected future land-related revenue as collateral or as a basis for financing, effectively magnifying “land finance” into a broader financing mechanism.
5.5.2. Why Use Land-Based Finance?
Urbanization requires very large amounts of capital. Land-conveyance revenue alone is often insufficient.
5.5.3. How Does Land-Based Finance Work?
5.5.3.1. Infrastructure Investment
A government may transfer land-use rights to a local-government financing vehicle (LGFV). The LGFV can use land or related assets as collateral to borrow from banks and undertake demolition, land preparation, and primary land development. Property developers then undertake construction and operation at the secondary-development stage.
First, why were LGFVs needed?
- Urbanization required large amounts of funding, while local governments historically faced legal and institutional restrictions on direct borrowing from banks.
- Urban infrastructure projects are complex. Some generate revenue while others do not, but both may be necessary, so projects may be bundled together.
- Fiscal revenue alone may be insufficient to service the resulting debt, so land-related revenue becomes part of the financing model.
Second, what are LGFVs?
Typical characteristics include:
- Holding land-use rights or other assets transferred by local governments.
- Profitability that may depend partly on government support or subsidies.
- An expectation of government backing that can lower financing costs and expand borrowing capacity.
5.5.3.2. Industrial Investment
Government can also help firms enter complex industries, using learning effects, economies of scale, and technology spillovers to improve local manufacturing capabilities and international competitiveness. Government-guided industrial funds are one example.
5.5.4. Problems with Land-Based Finance
The central problem is debt risk.
5.6. Debt
5.6.1. Debtors
5.6.1.1. Local-Government Debt
Video on infrastructure and development
5.6.1.1.1. Local Debt Reform
- Debt swaps
- Replace part of LGFV bank loans and urban-investment bonds with bonds issued by local governments.
- Transform LGFVs
- Separate commercial operations from government financing functions and reduce reliance on implicit government backing.
- Constrain financial institutions’ lending
- Limit excessive flows of credit into LGFVs and strengthen lender discipline.
- Hold officials accountable
- Strengthen accountability for excessive or irregular borrowing.
Why might local governments have incentives to keep expanding investment? Some research links local debt and urban-investment-bond issuance to growth pressure, promotion incentives, and uncertainty around officials’ tenures. The effects vary across regions, types of officials, and types of debt, so they should not be reduced to a single motive. Reference: Local officials’ promotion incentives and issuance of urban investment bonds
5.6.1.2. Household Debt
A major issue is the combination of high housing prices and large mortgage burdens. During a recession, if households lose income while housing prices fall, mortgage repayment can become harder and financial risk can rise.
5.6.1.2.1. Why Are Housing Prices High?
Over the medium and long run, housing prices are strongly influenced by supply and demand.
Demand: population and jobs may flow into particular cities. Supply: construction-land quotas and planning constrain how much land can be developed.
If demand grows faster than supply, housing prices can rise.
5.6.1.2.2. Possible Responses
Raise incomes and improve labor mobility: hukou reform. Video on the hukou system
Increase land supply and improve land allocation: land-market and land-use reforms.
5.6.1.3. Corporate Debt
5.6.1.3.1. Debt of Local-Government Financing Vehicles
5.6.1.3.2. The Debate over “State Advances, Private Sector Retreats”
5.6.1.3.3. Real-Estate Developer Debt
5.6.2. Creditors
5.6.2.1. Banks
- Financial liberalization can expand the scale of credit and debt.
- Banks often prefer loans secured by land and property.
- Banking risk can transmit to other sectors.
5.6.3. How Can Debt Risk Be Addressed?
- Repay, restructure, or otherwise resolve existing debt.
- Limit the accumulation of unsustainable new debt.
6. Technology in China’s Socialist Market Economy
6.1. How Does Technology Promote Economic Development?
6.2. How to Think about Technology
Technology = f(R&D, human resources, incentives)
6.2.1. Research and Development
Lower- and middle-income economies generally spend less on R&D as a share of GDP. As economies move into middle-income and higher-income stages, R&D intensity often rises.
China’s broad development path:
- In the 1950s, the Soviet Union provided substantial technical support.
- In the 1960s, Soviet support ended and China relied more heavily on domestic development.
- After reform and opening up, research priorities broadened gradually.
- After 2000, R&D became increasingly diversified across civilian, industrial, and strategic fields.
6.2.2. Human Resources
Higher education expanded continuously, although quality differs across universities, disciplines, and training programs.
After reform and opening up, the number of Chinese students studying abroad expanded substantially. From the 2000s onward, the number of returnees also rose markedly.
The “Thousand Talents Plan” was launched in 2008.
6.3. China’s Technology-Development Strategy
6.3.1. 1978-2003
External channels:
- Large-scale purchases and imports of foreign technology
- Using access to the domestic market to attract foreign investment and technology
Domestic channels:
- Dedicated R&D funding
- Support for domestic firms
6.3.2. Early 21st Century
Regional innovation systems became increasingly concentrated around Beijing, Guangdong, and Shanghai.
6.3.3. After 2006
- 2006: the Medium- and Long-Term Program for Science and Technology Development
- 2010: strategic emerging industries
- 2015: Made in China 2025 and Internet Plus
Technology Roadmap for Key Areas of “Made in China 2025”
6.4. How Does China Use Policy to Support Technology Development?
- Direct funding
- Investment funds
- Demand-side policies
- The regulatory environment
7. Natural Resources in China’s Socialist Market Economy
7.1. Terrain
China’s terrain is generally high in the west and low in the east:
- First step: the Tibetan Plateau
- Second step: a series of plateaus and basins
- Third step: plains and hills
Three major river systems discussed here are the Yellow River, Yangtze River, and Pearl River.
The Heihe-Tengchong Line illustrates the strong concentration of population in eastern China relative to the west.
Arable land is relatively limited compared with the size of the population.
7.2. Climate and Water Resources
The southeast monsoon brings relatively wet summers and drier winters to much of eastern China. Mountain ranges and distance from the coast weaken monsoon influence toward the west.
Water resources are unevenly distributed. Northern China is relatively water-scarce while southern China has more abundant water resources. This imbalance is one of the reasons for the South-to-North Water Diversion Project.
7.3. Natural Resources
Mineral, coal, and other natural resources are unevenly distributed and some are scarce relative to demand.
8. Population in China’s Socialist Market Economy
8.1. Population
8.1.1. Three Major Population Challenges
- An imbalanced sex ratio
- The weakening of the demographic dividend
- Population decline and aging
8.1.2. China’s Demographic Transition
In the traditional demographic regime, both birth rates and death rates were high.
As modernization progressed, mortality declined. From the mid-20th century, population grew rapidly for a period.
Later, fertility declined as a result of changing social conditions and attitudes, so the period of rapid population growth did not continue indefinitely.
Two special points:
- Mortality rose sharply during the difficult years of 1959-1961.
- From the 1970s onward, fertility policy, urbanization, rising education levels, and changes in family preferences all contributed to lower birth rates.
8.1.3. The Demographic Dividend
8.1.3.1. What Is the Demographic Dividend?
It is the potential economic-growth effect associated with a rising share of working-age people in the total population.
Demographic dividend - Wikipedia
Discussion of the demographic dividend
8.1.3.2. Why Can a Demographic Dividend Promote Growth?
A higher working-age share and a lower dependency ratio can expand the effective labor supply and support growth through employment, savings, investment, and human-capital accumulation. When labor supply is abundant, it can also support labor-intensive industries.
8.1.3.2.1. Automatic Demographic Mechanism
When mortality falls first and fertility declines later, there can be a temporary window in which the working-age share of the population rises.
As a large birth cohort reaches working age, per-capita output can increase if those workers find productive employment while child and elderly dependency ratios decline.
8.1.3.2.2. Savings Effect
Life-cycle theory generally suggests that people are more likely to accumulate savings during their working years and may gradually draw down previously accumulated assets after retirement.
8.1.3.2.3. Human-Capital Effect
Investment in children’s education can raise future human capital.
Physical capital refers to capital embodied in physical assets such as factories, machinery, equipment, raw materials, and land. Human capital refers to productive capacity embodied in people, including the resources spent on education and the opportunity cost of time spent acquiring skills.
8.1.4. Major Population Trends
8.1.4.1. Age Structure
A population pyramid is a bar chart showing the age and sex composition of a population. It can be used to analyze current demographic structure and future trends. Three simplified types are:
- Expansive/young: wide at the bottom and narrow at the top, indicating a relatively large younger population.
- Stationary/adult: more even through much of the age range.
- Constrictive/aging: narrower at the bottom, indicating a smaller share of younger people.
8.1.4.2. Age and Consumption
A rough life-cycle view in the original note:
- Ages 0-18: consumption rises as children grow.
- Ages 18-30: consumption generally rises.
- Ages 30-50: household-upgrading demand can be strong; home purchases can become important.
- Ages 50-80: some categories of consumption may slow while healthcare and service consumption become more important.
8.1.4.3. Baby Booms
The original note roughly identifies several large birth cohorts around the mid-1950s, early 1960s, and mid-to-late 1980s.
8.1.4.4. Population Aging
China’s population aged 16-59 reached its peak in 2012 and has generally declined since then. China’s total population recorded negative growth in 2022.
8.2. Labor
8.2.1. Current Labor-Force Structure
China still has a very large working-age population, but the working-age share is declining and population aging is changing the structure of labor supply.
Urban employment can be discussed in three broad categories:
- Public sector
- Formal private sector
- Informal sector
8.2.2. Changes in Labor Institutions
From the planned-economy period, urban employment was heavily shaped by administrative job allocation, with limited labor mobility.
From the 1990s into the early 2000s, restructuring of state-owned enterprises led to large-scale layoffs and re-employment pressures.
Beginning in the 1990s, large numbers of rural workers migrated to cities. Many migrant workers initially entered temporary, informal, or lower-protection employment.
The urban labor market then changed substantially. The boundary between formal and informal employment increasingly depended on factors such as employer type, contract status, social-insurance coverage, and household-registration status.
Background on the SOE layoff wave
8.2.3. What Determines Labor-Market Outcomes?
When studying differences in productivity, wages, and employment, common variables include education, work experience, gender, region, industry, and ownership type.
8.2.4. Labor Supply
Changes in China’s labor supply are often discussed using the “Lewis turning point” framework.
In the early stage of development, rural areas can contain large amounts of underutilized surplus labor, allowing industrialization to draw on a large supply of relatively low-cost workers. As surplus labor is gradually absorbed and wages rise, growth needs to rely more on productivity gains, technology, and capital deepening.
The Lewis turning point refers to the transition from abundant surplus labor toward relative labor scarcity.
9. Reform in China’s Socialist Market Economy
9.1. China’s Economy Before 1949
9.1.1. 1127-1911
Keyword: traditional economy
-
Three important elements of traditional agriculture: seed selection, organic fertilizer, and irrigation. Output per unit of land could be high, while output per unit of labor was relatively low.
-
Dense rural populations and transportation networks supported a commercialized economy with mature institutions, competitive markets, and smallholder farming.
-
The original note characterizes China overall as being around the global average, with the more developed regions substantially better off.
-
In the early 19th century, China exported tea, silk, and other goods and maintained a strong position in foreign trade for a long period. The subsequent expansion of the opium trade intensified problems involving silver flows, public finance, and social order.
-
After the Qing government strengthened opium suppression, Sino-British conflict escalated into the First Opium War. China then experienced repeated foreign wars, internal rebellions, and institutional crises, gradually weakening Qing rule.
9.1.2. 1912-1937
Keyword: the beginning of modernization
After the 1911 Revolution brought down the Qing dynasty, China’s political institutions and economic structure entered a period of accelerated change.
- Industry: the original note records annual growth of roughly 8-9%, with two broad patterns—“treaty-port industrialization” and “Manchurian industrialization.”
- Agriculture: inequality was substantial, infrastructure deteriorated in some areas, and natural disasters imposed severe hardship on poorer households.
- Overall: industrialization had begun and laid part of the foundation for later development.
9.1.3. 1937-1949
Keywords: the War of Resistance against Japan and the Chinese Civil War
- A Japan-centered East Asian economic sphere linked Japan, Korea, Taiwan, Manchuria, and parts of mainland China.
- During the Japanese occupation of Northeast China, industrial investment and the scale of heavy industry expanded significantly, but this development took place under colonial rule and a war economy.
- State intervention increased under the Nationalist government.
- From the later years of the war through the civil-war period, expanding fiscal deficits and uncontrolled monetary issuance were among the factors that produced hyperinflation.
- Overall, China’s economic output and living standards were badly damaged by prolonged war.
9.1.4. 1949-1978
The period from 1127 to 1949 left multiple historical legacies. Long wars and foreign invasion strengthened concerns about national security and industrialization; postwar hyperinflation and institutional disorder weakened the existing economic system; and part of the industrial base left in Northeast China also influenced the industrialization path after 1949.
The economy moved away from the traditional household-based agrarian system toward a command economy with direct government control and a “big push” strategy prioritizing socialist heavy industry.
9.1.4.1. The Big-Push Strategy
The “big push” is an economic-development idea in which a developing country or region makes large-scale investments across multiple sectors at the same time, seeking complementary growth across sectors and faster overall development.
Investment took a high share of GDP, with a large portion directed toward industry, especially heavy industry.
To understand heavy industry, consider the industrial chain:
- Upstream: extraction of natural resources and raw-material industries
- Midstream: processing and refining materials and supplying machinery industries
- Downstream: production of final consumer and investment goods
Heavy industry emphasizes much of the upstream and midstream portions of this chain.
Taiwan and Hong Kong, by contrast, developed more strongly through light manufacturing and downstream export industries during important parts of this period.
9.1.4.2. The Command Economy
A command economy is an economic system in which production, resource allocation, and much of consumption are organized according to economic plans.
- The government owns factories and other major productive assets.
- Planning authorities assign production targets and allocate resources among producers.
- The government controls much of the price system.
- Personnel and administrative systems reinforce state control over economic activity.
The combination of state ownership and administered prices can create deliberately different relative prices between industrial and agricultural goods.
9.1.4.3. Viewing Economic Development through Major Political and Policy Shifts
Political campaigns and changes in leadership priorities were frequent during this period, and economic policy also underwent repeated, substantial adjustments.
9.1.4.3.1. 1949-1952: Economic Recovery
Background: China aligned more closely with the Soviet bloc, while the Korean War was accompanied by trade restrictions and sanctions from Western countries.
Rural areas: land reform redistributed land to poor peasants.
Cities: the government took over or reorganized a substantial number of enterprises.
Result: economic recovery and reconstruction created the conditions for nationwide socialist industrialization.
9.1.4.3.2. 1953-1956: The First Five-Year Plan
In 1953, China began a nationwide investment program modeled in important respects on Soviet planning. Industrial investment rose rapidly, and the state introduced unified purchase and marketing arrangements for major agricultural products. The Soviet Union provided substantial assistance.
At the beginning of the period, parts of the economy still retained mixed features: much agriculture remained household-based, and private factories and shops still existed in cities.
In 1955, collectivization accelerated. Most rural households joined collective agricultural organizations, while private urban enterprises were increasingly reorganized into cooperative or joint state-private forms.
Result: the Soviet-style planning model became much more comprehensive.
9.1.4.3.3. 1956-1957: Adjustment and the Hundred Flowers Period
Background: de-Stalinization in the Soviet Union and debates about different socialist development paths influenced China’s policy environment.
Because the earlier pace of industrialization had created growing economic pressure, policy temporarily shifted toward adjustment. During the Hundred Flowers period of 1956-1957, the political and intellectual environment briefly became more open, and economic policy also underwent some adjustment.
9.1.4.3.4. 1958-1960: The Great Leap Forward
After the Anti-Rightist Campaign of 1957, policy shifted toward a more radical development line, and the Great Leap Forward began in 1958.
Large amounts of labor and resources were moved from agriculture into industry while grain procurement pressure increased. Academic research generally finds that multiple factors contributed to the severe famine of 1959-1961, including diversion of agricultural resources, excessive procurement, failures of incentives and information, falling grain output, and weather. Policy and institutional factors were significant contributors.
Reference: The Great Leap Forward: Anatomy of a Central Planning Disaster
9.1.4.3.5. 1961-1963: Retrenchment and Readjustment
Liu Shaoqi, Chen Yun, and others supported more cautious economic policies.
Investment was cut, and a large number of urban workers were sent back to rural areas as part of the readjustment.
9.1.4.3.6. 1964-1966: Renewed Strategic Industrialization
Background: U.S. involvement in the Vietnam War increased national-security concerns.
Mao Zedong shifted strategy toward the Third Front construction program, which aimed to build industrial bases in inland and strategically protected regions.
9.1.4.3.7. 1967-1969: Early Cultural Revolution
Political movements significantly disrupted economic activity. Production, investment, and management order were affected to different degrees across years and regions.
9.1.4.3.8. Around 1970: Continued Third Front Construction
Third Front construction and industrial investment continued, with substantial resources still directed toward industrialization and strategically located industry.
9.1.4.3.9. 1972-1976: Adjustment
After the Lin Biao incident and amid the easing of China-U.S. relations, the external environment changed.
Some Third Front investment was adjusted, while foreign trade and imports of complete industrial equipment increased.
9.1.4.3.10. 1977-1978: The “Foreign Leap Forward”
After Mao Zedong’s death in 1976, the Hua Guofeng period saw proposals for a large industrial-investment program, with plans to use oil exports and foreign-exchange earnings to import complete sets of Western industrial equipment.
Constraints involving investment scale, foreign exchange, and fiscal capacity led to later adjustments.
9.1.4.3.11. The Third Plenum of the 11th Central Committee
After the Third Plenum in 1978, the policy focus gradually shifted toward economic development and the reform-and-opening process began.
9.1.4.3.12. Summary
Under the command economy, investment and resource allocation repeatedly moved through cycles of acceleration, overheating, and adjustment. Constraints in agriculture, public finance, foreign exchange, and industrial supply meant that overly rapid industrialization could create imbalances that later required retrenchment.
Negative aspects:
- Heavy emphasis on industry came at the expense of consumption, while services received relatively little attention.
- Employment growth was relatively slow in some phases.
- Much industrial investment was capital-intensive, technologically demanding, slow to build, and slow to generate returns.
Positive aspects:
- Significant resources went into basic health and education, contributing to the accumulation of human capital.
9.1.5. After 1978
One historical legacy of the pre-1949 economy was that household production and market exchange still had deep roots in rural China. The experience of coastal treaty ports and outward-oriented commerce also provided historical reference points for later coastal opening and special economic zones.
9.1.5.1. Reform
The broad direction of reform was toward greater use of market mechanisms.
What is reform? In this context, it is a set of policies that changes the rules under which economic actors make decisions.
Reform changes existing interests and patterns of resource allocation, while its potential benefits often take time to appear. China therefore used gradualism, local experimentation, pilots, and dual-track transitions extensively.
9.1.5.2. The Reform Process
9.1.5.2.1. 1979-1982: Rural Reform
Agricultural market mechanisms were gradually liberalized, procurement arrangements were adjusted, and China also used scarce foreign exchange to import grain.
The core institutional change was the household responsibility system: rural households became responsible for production on contracted plots, fulfilled specified delivery or tax obligations, and retained more of the remaining output and income.
Results:
- Grain output increased substantially.
- Surplus rural labor increasingly moved into township and village enterprises and other non-agricultural activity.
Effects:
- Better market incentives on the supply side could raise agricultural output.
- The reform approach stabilized existing obligations through contracts while allowing market transactions beyond planned quotas—an early form of the dual-track approach.
- Foreign-exchange pressure eased as agricultural performance improved.
- Rising rural incomes broadened support for reform.
9.1.5.2.2. 1984-1989: Accelerated Transition
The dual-track system was a transitional mechanism from planning toward markets. The same good could have one administered price within the state-plan quota and another market-determined price outside the quota.
Dual-track pricing - Wikipedia
Dual-track pricing and market-oriented reforms increased flexibility in resource allocation, but they were also accompanied by rapid investment growth and inflationary pressure. Macroeconomic stabilization relied on administrative controls, tighter credit, and fiscal and monetary adjustments.
China’s high savings rate reflected multiple factors, including income growth, the social-security system, expected housing and education expenses, and the structure of the financial system.
9.1.5.2.3. 1989-1992: Transitional Period
After the political turmoil of 1989, reform faced stronger policy debate and temporarily slowed.
Deng Xiaoping’s southern tour in 1992 was followed by a renewed acceleration of market-oriented reform.
1989 Tiananmen Square protests and massacre - Chinese Wikipedia
9.1.5.2.4. 1993-1999: Accelerated Institutional Transition
Major institutional reforms were carried out across four core economic areas.
- Fiscal and tax system
The reforms strengthened the central government’s fiscal capacity and changed central-local revenue sharing.
- Banking and financial system
The People’s Bank of China was strengthened as the central bank, while reforms addressed weak financial discipline and non-performing assets in state-owned banks.
- Ownership and corporate governance
Many state-owned enterprises were reorganized into modern corporate forms and exposed to stronger market competition. The restructuring also contributed to a large wave of layoffs and re-employment pressures.
- Foreign trade
Trade and exchange-rate reforms deepened and the economy became more integrated with global markets.
This stage involved reforms with clearer winners and losers, including restructuring in state enterprises and preparations for WTO accession.
9.1.5.2.5. After 2003
While market-oriented reforms continued, policy placed greater emphasis on social security, public services, regional balance, and environmental governance.
9.1.5.2.6. After 2013
The Third Plenum of the 18th Central Committee in 2013 called for “comprehensively deepening reform,” emphasizing a decisive role for the market in resource allocation while also calling for government to perform its functions better. Subsequent reforms proceeded alongside industrial policy and regulatory policy.
10. International Trade in China’s Socialist Market Economy
10.1. International Trade
10.1.1. Historical Background
From 1949 to 1960, China’s trade orientation shifted away from the Pacific toward the Soviet Union. China imported steel, diesel, machinery, and other industrial materials while exporting textiles, processed food, and other goods.
After the Sino-Soviet split around 1960, foreign trade stagnated for a period.
In the 1970s, oil exports provided foreign exchange that could be used to purchase foreign technology and equipment. Later foreign-exchange constraints became one of the pressures encouraging a broader opening of the economy.
- 1978: reform and opening up began.
- 2001: China joined the WTO.
10.1.2. How Did China Reform Foreign Trade?
10.1.2.1. Starting Constraints
Two major constraints were:
- Centralized control over foreign trade
- A tightly managed foreign-exchange system
10.1.2.2. 1978-1979
Guangdong and Fujian began cautious experiments with more flexible foreign economic policies. Hong Kong played an important intermediary role, and export-processing trade expanded.
10.1.2.3. Mid-1980s
- The exchange-rate system was adjusted in ways that improved export competitiveness.
- The state monopoly over foreign trade was gradually loosened and more foreign-trade companies were allowed to operate.
- Price controls were relaxed, allowing international prices to influence domestic prices more directly.
- Tariff and non-tariff trade barriers were gradually reformed.
10.1.3. What Did China’s Foreign-Trade System Look Like?
A simplified dual structure:
- Ordinary/general trade
- Processing trade for export
Processing trade expanded particularly rapidly.
Difference between processing trade and general trade
10.1.3.1. International Division of Labor
One simplified way to view international specialization is to distinguish resource exporters, manufacturing economies, and major consumer markets.
China became a major manufacturing economy: it acted as a buyer when dealing with resource-exporting economies and as a supplier when selling manufactured goods to consumer markets.
10.1.4. Joining the WTO
10.1.4.1. Why Join the WTO?
WTO membership provided more stable access to global markets and also became a lever for domestic trade, regulatory, and institutional reform.
10.1.4.2. Reforms Associated with Accession
- Broader opening of ordinary trade
- Lower tariffs
- Changes in trade rules, licensing, and market access
10.1.5. What Did China Trade?
10.1.5.1. Imports
Historically important imports included natural resources, capital-intensive goods, machinery, and technology-intensive products.
10.1.5.2. Exports
In the earlier reform period, labor-intensive manufactured exports played a particularly important role. Over time, the export structure moved toward more capital- and technology-intensive products as well.
10.2. Foreign Direct Investment
10.2.1. What Is Foreign Direct Investment?
The balance of payments records a country’s transactions with the rest of the world.
The current account mainly includes trade in goods and services, primary income, and transfers. The financial account records most transactions involving cross-border financial assets and liabilities.
Foreign direct investment is an important part of the financial account. Other major categories include portfolio investment in stocks and bonds and other investment such as bank lending.
10.2.2. Development of Foreign Direct Investment
China began opening to foreign direct investment in the late 1970s.
During the 1980s, FDI inflows expanded gradually.
After Deng Xiaoping’s southern tour in 1992 and subsequent policy changes, the scope and scale of foreign investment increased sharply.
Over time, the pattern of FDI changed as industrial policy, market-access rules, comparative advantage, and the structure of the Chinese economy evolved.
10.2.3. Special Economic Zones and Foreign Investment
Special economic zones became important platforms for opening up and attracting foreign direct investment. They also served as experimental areas for domestic economic reform.
The earliest SEZs were concentrated on the coast and benefited from proximity to Hong Kong, Macao, overseas Chinese business networks, ports, and international trade routes.
10.2.3.1. Development of the Special Economic Zones
- 1980: Shenzhen, Zhuhai, Shantou, and Xiamen were formally established as the first group of special economic zones.
- During the 1980s, SEZs developed rapidly.
- In the early 1990s, the development and opening of Pudong marked another major phase of coastal opening and reform.
- By the early 21st century, China had established many types of development zones and industrial parks.
- Since 2013, China has progressively established and expanded pilot free-trade zones.
10.2.4. Effects of FDI on the Host Economy
Possible effects include:
- Additional investment and capital formation. This mattered alongside China’s already high domestic saving and investment rates.
- Expansion of trade and integration into global production networks.
- Technology transfer.
- Greater competition for domestic firms, which can reduce prices and profit margins while encouraging productivity improvements.
- Technology and knowledge spillovers through supply chains, workers, suppliers, and competitors.
10.2.5. Sources of FDI
Historically, Hong Kong has been one of the most important sources of FDI into mainland China.
Other important sources have included the United States, Taiwan, Japan, South Korea, Singapore, and other economies. Rankings vary by year and statistical methodology.
10.2.6. Sector Structure of FDI
In earlier stages, a large share of FDI went into manufacturing.
As opening expanded and the economy became more service-oriented, services also became increasingly important in attracting foreign investment.
10.3. Outward Direct Investment
10.3.1. How Did China Invest Abroad?
Hong Kong has often served as an important intermediary and financial platform for mainland Chinese outward investment.
10.3.2. Investment Destinations
China’s outward direct investment destinations gradually diversified across Asia, Europe, North America, Oceania, Latin America, Africa, and other regions.
Rankings differ substantially by year and statistical methodology.
10.3.3. Investment Direction
In the earlier stages of China’s outward investment, natural-resource projects were relatively important, and cross-border mergers and acquisitions were also a common form of investment.
Large state-owned enterprises initially accounted for a substantial share of outward investment, while the participation of private firms increased significantly over time.
11. Summary: The Economic Machine Can Keep Running without Any One Person, but People Are Not Machines
12. References
An Overview of Four Revolutions in the History of Economics
A Brief History of Economic Thought - Research Report
Development of the Socialist Economy in the Soviet Period
Discussion of Differences in GDP Accounting between China and the United States
How Central-Bank Balance-Sheet Expansion and Contraction Affect the Economy
How Central Banks Create Money and What Balance-Sheet Expansion/Contraction Means
Discussion
Sign in with GitHub to comment. Discussions are stored as GitHub Issues.View on GitHub