
NOTE
Consumer Behavior Theory
English translation of the original VNote “Consumer Behavior Theory”, preserving its structure and content.
This is a historical learning note and may contain outdated or incomplete understanding.
1. Utility
1.1. What It Is
- Utility is the degree to which a desire is satisfied and is subjective.
- It has both common characteristics and individual characteristics.
- Individual characteristics
- Varies from person to person.
- Varies over time.
- Varies by place.
- Individual characteristics
- When economic conditions are good, people may not care much; when economic conditions are poor, they may value it especially highly.
1.2. Types of Utility
- Total utility
- The total degree of satisfaction obtained from consuming a certain quantity of goods. Represented by TU.
- Marginal utility
- The increase in utility from consuming one additional unit of a good. Represented by MU.
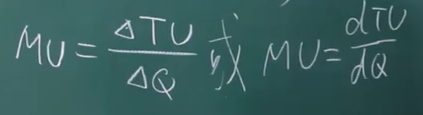
1.2.1. Marginal Utility
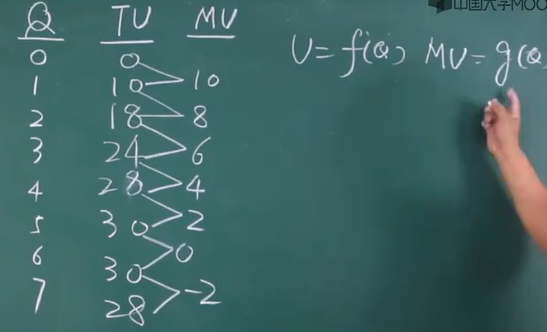
- The sum of marginal utility equals total utility.
- Marginal utility diminishes.
2. The Consumer’s Best Decision
2.1. Why Make Consumption Decisions?
- Income is limited.
- Time is limited.
- Goods are limited.
- Prices change.
2.2. How Does a Consumer Make the Best Decision?
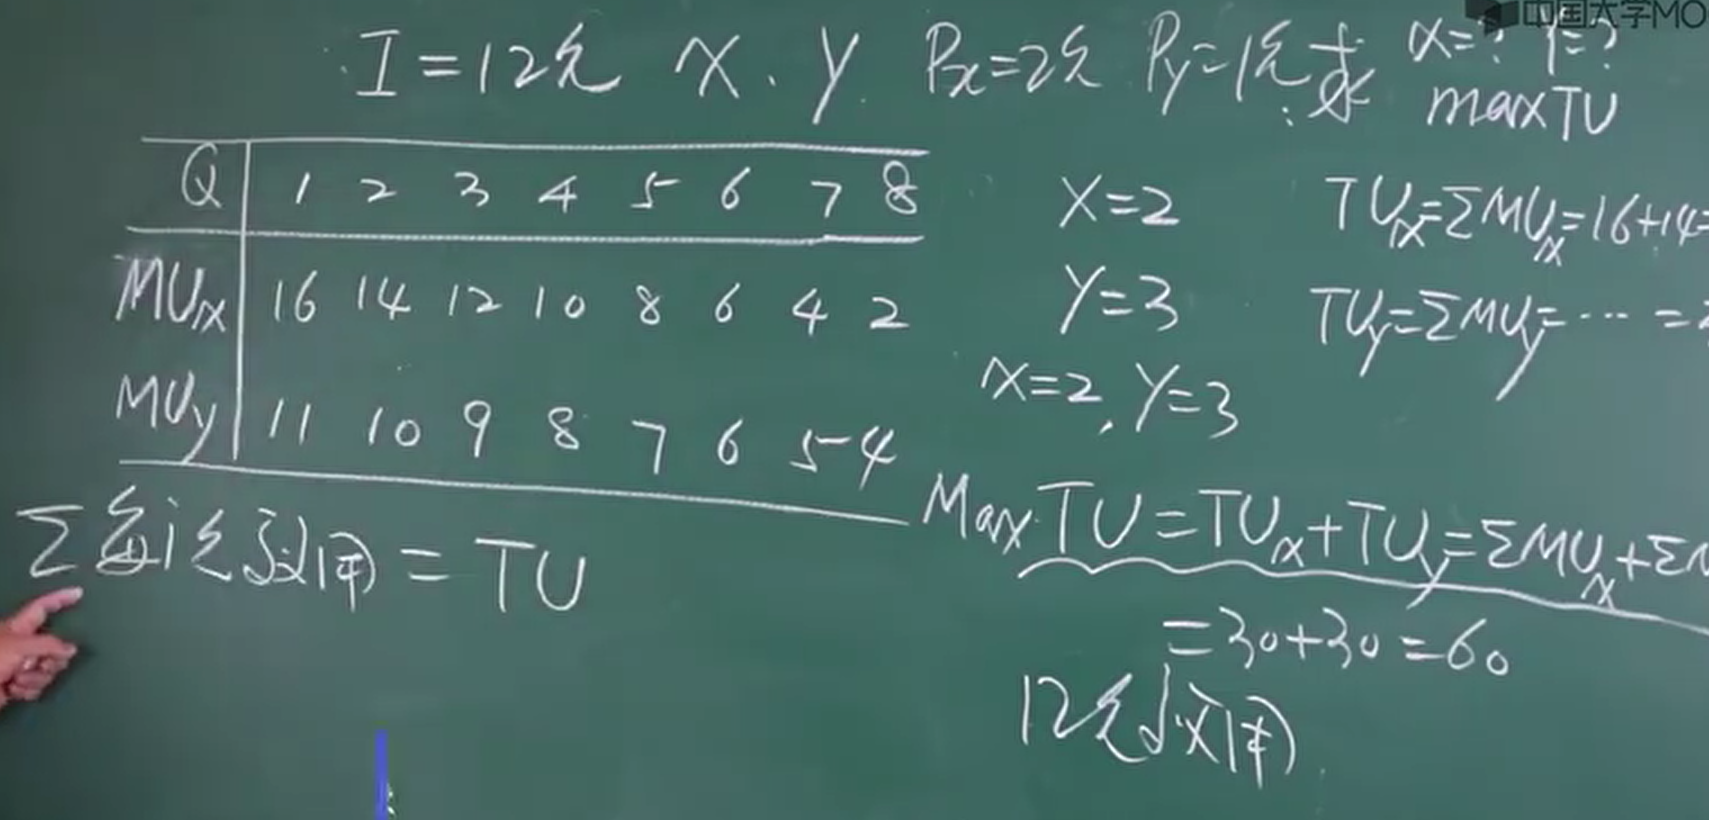
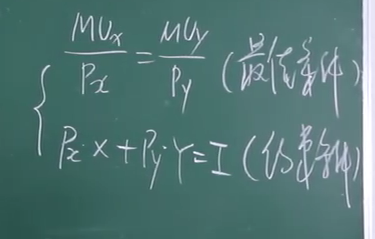
- Suppose you have 12 yuan. Spend all the money and make every yuan count.
- Rewrite the table using monetary utility.
- The utility value of one yuan is called monetary utility.
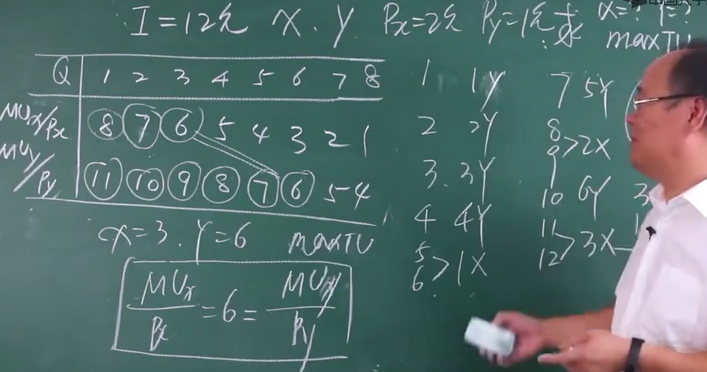
- Conclusion
3. Consumer Surplus
3.1. What It Is
- Consumer surplus = willingness to pay - actual payment.
- Willingness to pay is determined by the size of marginal utility.
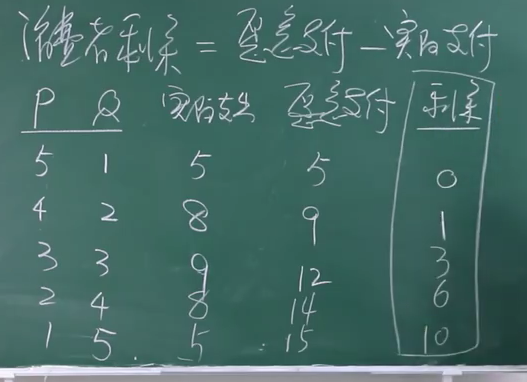
- The lower the price, the greater the surplus.
3.2. Uses
- The government should control the price level.
- The more developed the market economy, the greater the surplus.
4. Tools
4.1. Indifference Curves
4.1.1. What Is an Indifference Curve?
4.1.1.1. Consumer Preferences
- The degree to which consumers like goods.
- Three assumptions
- Completeness
- For two bundles A and B, exactly one of A>B, A=B, or A<B must be chosen.
- Transitivity
- If A>B and B>C, then A>C.
- Nonsatiation
- More quantity is better.
- Completeness
4.1.1.2. Indifference Curve
- The locus of different combinations of two goods that can provide the same level of satisfaction.
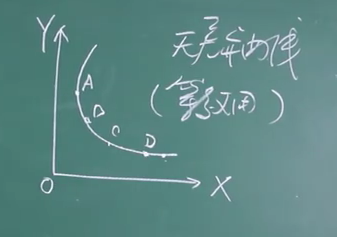
- Each point represents a combination of X and Y.
4.1.2. Characteristics of Indifference Curves
- There are infinitely many indifference curves, each representing a unique utility level.
- A curve located higher represents a higher utility level.
- Any two curves cannot intersect.
- Convex to the origin.
4.1.3. Special Cases of Indifference Curves
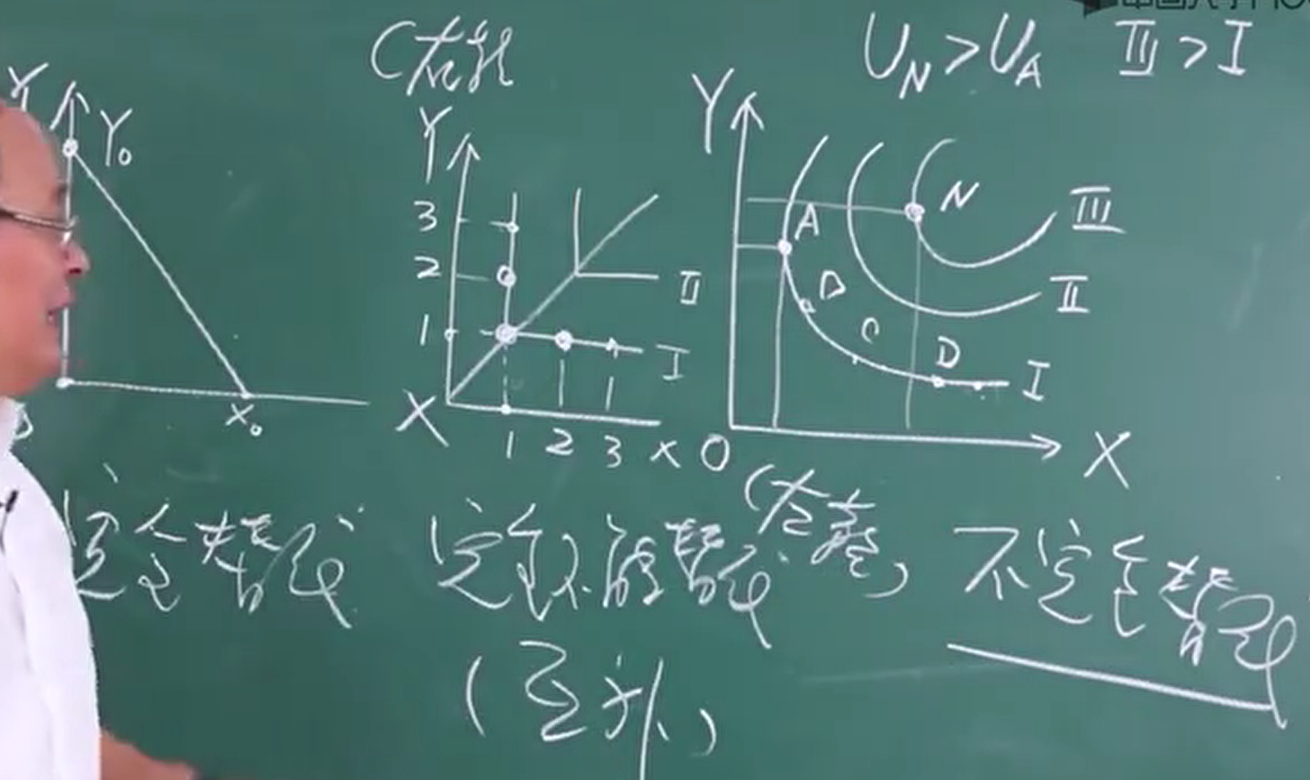
- Perfect substitutes.
- Complements.
- The normal case is imperfect substitutes.
4.2. Budget Constraint Line
4.2.1. What It Is
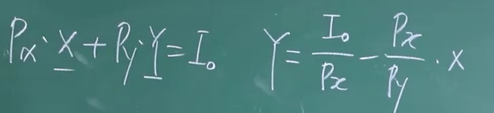
- Budget constraint equation
- Budget constraint line
- With income fixed, the locus of the maximum combinations of two goods that a consumer can purchase.
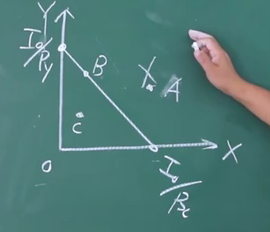
- Points on the line mean all the money is spent.
- Points outside the line mean there is not enough money.
- Points inside the line mean not all the money is spent.
4.2.2. Factors Affecting the Budget Constraint Line
- It is affected by income and prices.
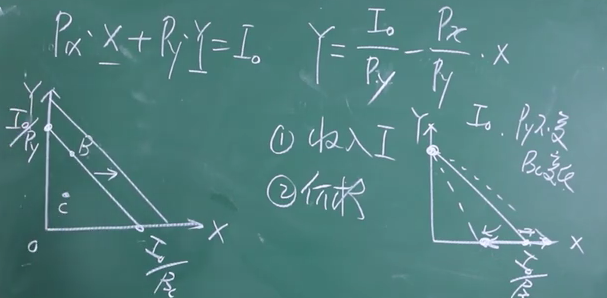
- A change in income shifts the line in parallel.
- A price change rotates the line inward; the opposite change rotates it outward.
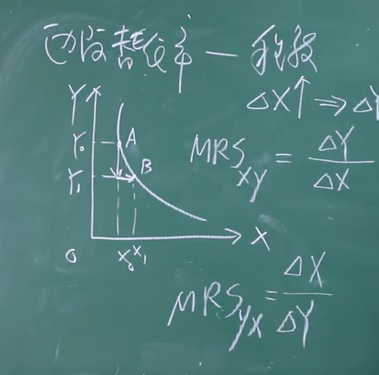
4.2.3. Marginal Rate of Substitution
- Used to measure the degree to which goods can substitute for one another.
- The larger the indicator, the easier substitution is.
- The marginal rate of substitution diminishes.
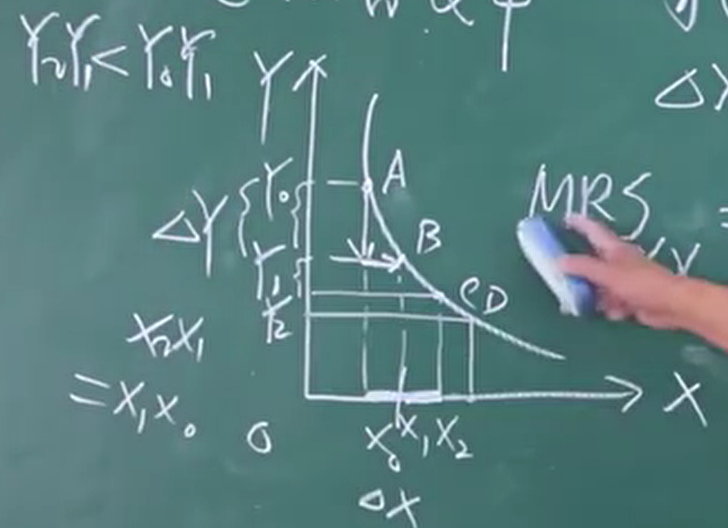
- X0X1 = X1X2, but Y0Y1 > Y1Y2.
5. Consumer Equilibrium
5.1. What It Is
- The consumer’s optimal-choice problem is also called consumer equilibrium.
- With income fixed, the combination of goods a consumer can buy that maximizes utility is called consumer equilibrium.
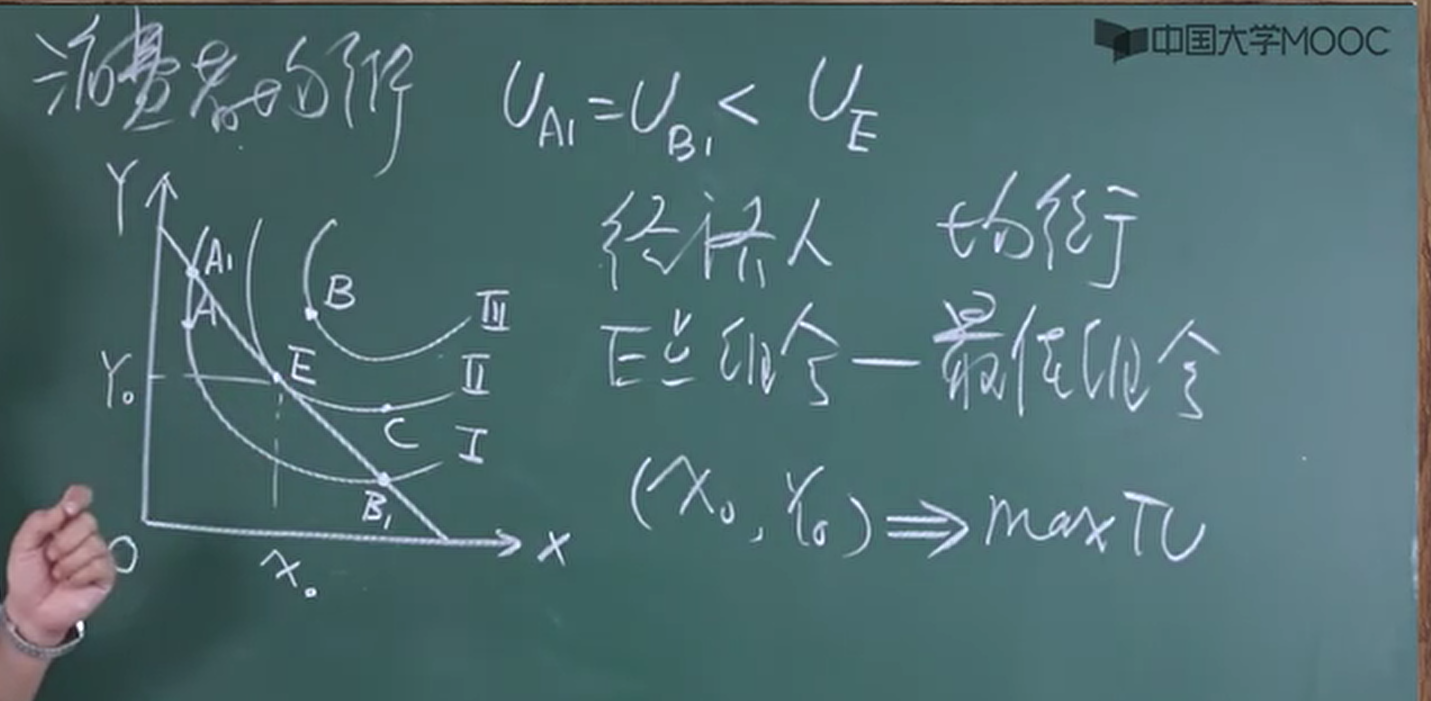
- The curve in the figure is the indifference curve, the straight line is the budget constraint line, and the point where they are tangent is consumer equilibrium.
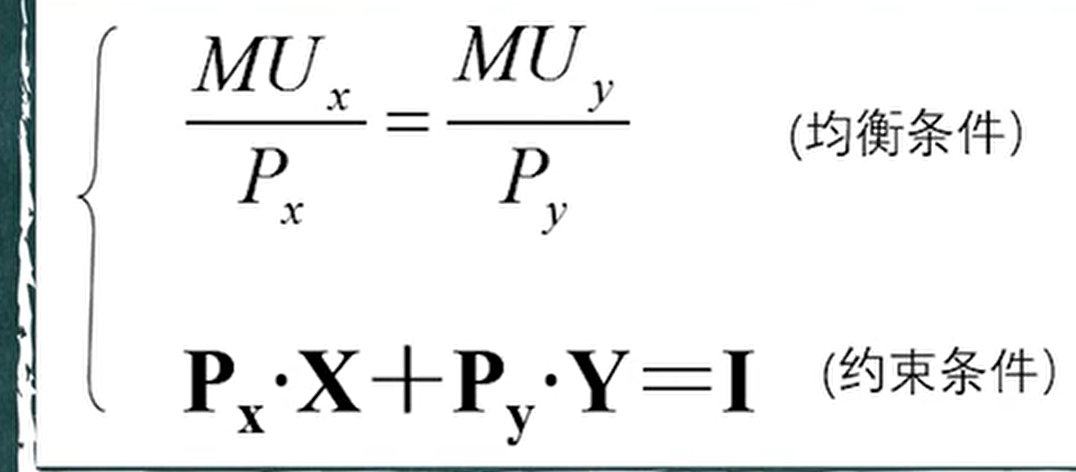
- The condition at this point:
5.2. Changes in Consumer Equilibrium
- Price changes
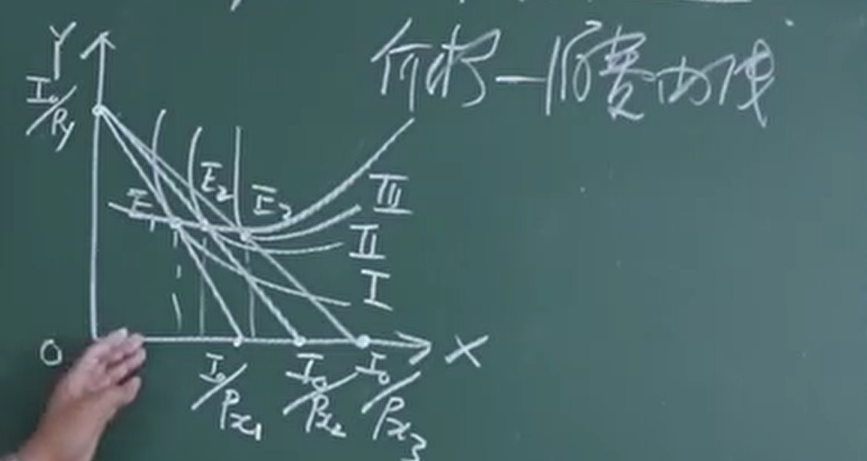
- This curve is called the price-consumption curve: with income unchanged, it is the locus of changes in the consumer-equilibrium position caused by price changes.
- After price changes, demand also changes.
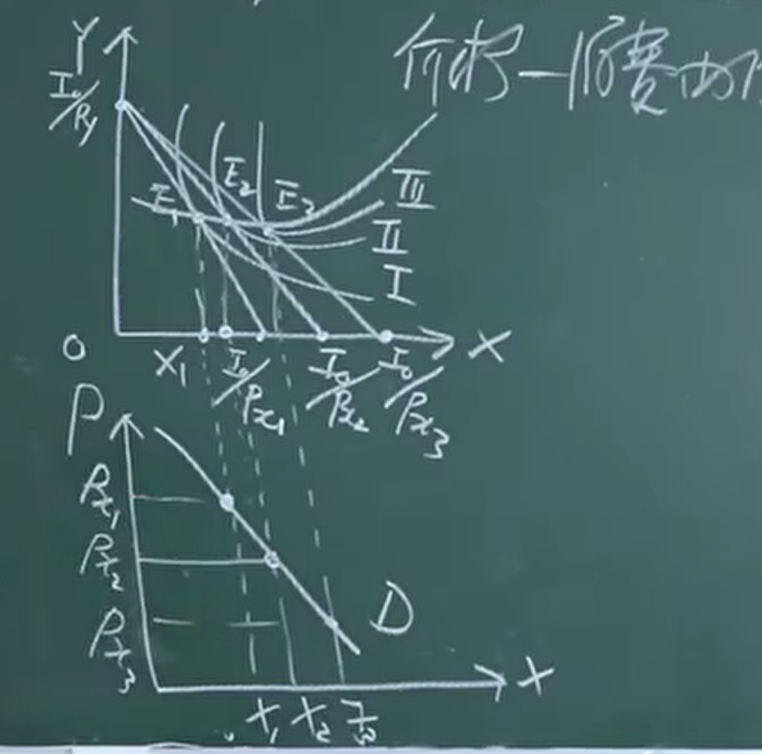
- This curve is called the demand curve.
- Income changes
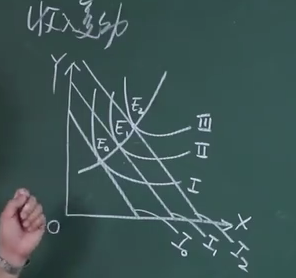
- This curve is called the income-consumption curve: the locus of changes in consumer equilibrium caused by changes in income.
- After income changes, demand also changes.
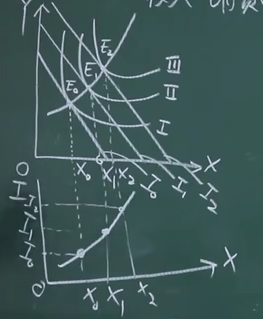
- This curve is called the Engel curve: the relationship between income and demand for a good.
6. Income Effect and Substitution Effect
- Total effect = income effect + substitution effect.
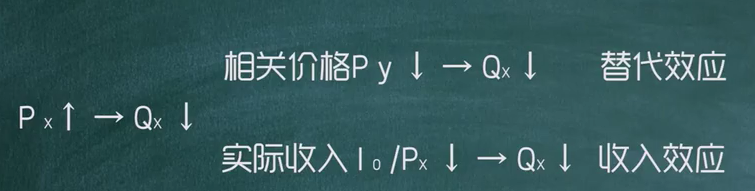
- Substitution effect: a change in relative prices causes product substitution and affects consumer demand; this is called the substitution effect.
- Income effect: a price change causes a change in real income, which causes a change in consumer demand; this is called the income effect.
Discussion
Sign in with GitHub to comment. Discussions are stored as GitHub Issues.View on GitHub