
NOTE
How to Design Log Monitoring
What log monitoring is, why it is needed, logging strategy, collection, aggregation, indexing and storage, analysis, and ELK.
This is a historical learning note and may contain outdated or incomplete understanding.
1. What Is Log Monitoring
Collect logs from code in one place for unified querying and processing.
2. Why Log Monitoring Is Needed
Without log monitoring, you need to log in to each machine to query logs, which is very inefficient.
3. How to Implement Log Monitoring
3.1. Output Logs
- The application prints logs and outputs them to local files.
- Logging strategy:
- Distinguish log levels.
- Key paths and exception paths.
- Print complete information:
- req, rsp, error, etc.
- Include extended information:
- server # Application name / ServerRPCName
- func # Function name / CalleeMethod
- clientip # Callee IP
- client_type # Callee client type
- uid # User uid/qbid
- original_id # User original account id (uin/tinyid/guid)
- msg # Business-reported information
- obj1 # Environment / env name
- obj2 # IPv6 address
- obj3 # Version number / version
- obj4 # TraceID
- obj5 # Reserved field 5
- obj6 # Reserved field 6
- obj7 # Reserved field 7
- level_key # ATTA default field (log level)
- caller_key # ATTA default field (file line number)
- Do not print sensitive information.
3.2. Collect Logs
- Collect log files from each server.
3.3. Aggregate and Process Logs
- Logs are unstructured data and need to be converted into structured data for querying and analysis.
3.4. Index and Store Logs
- Index and store structured logs.
- Elasticsearch.
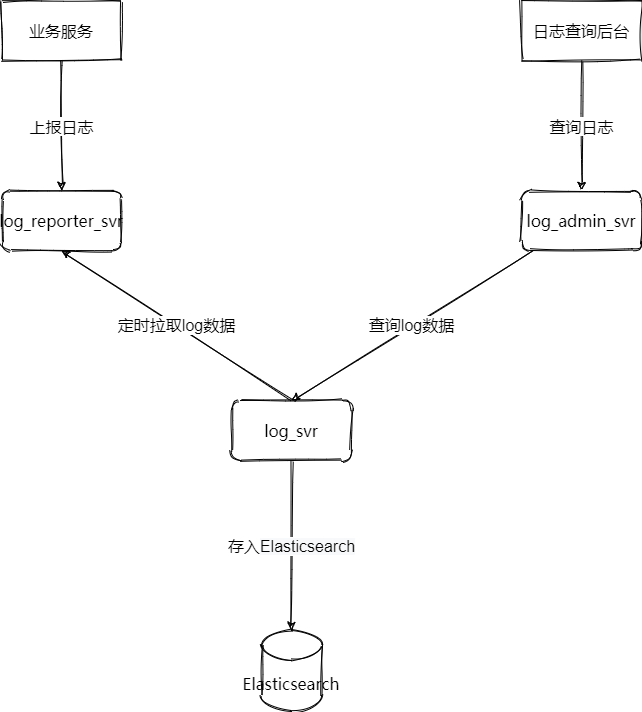
3.5. Analyze and Query Logs
- Query logs, analyze them, and output statistical charts.
4. Log Monitoring Components
4.1. ELK

Discussion
Sign in with GitHub to comment. Discussions are stored as GitHub Issues.View on GitHub