
NOTE
How to Design Metrics Monitoring
What metrics monitoring is, why it is needed, what to monitor, how to collect and store metrics, alerting, and common metrics components.
This is a historical learning note and may contain outdated or incomplete understanding.
1. What Is Metrics Monitoring
Record the time and value of events in order to observe trends.
2. Why Metrics Monitoring Is Needed
It can be used to observe trends and raise alerts before problems occur.
3. How to Implement Metrics Monitoring
3.1. What Data to Monitor
- System layer:
- The system layer mainly refers to monitoring hosts and containers.
- Metrics: CPU, disk, memory, network, etc.
- Middleware layer:
- The middleware layer mainly refers to monitoring middleware and storage, such as Nginx, Redis, ActiveMQ, Kafka, MySQL, Tomcat, etc.
- Application layer:
- The application layer refers to monitoring from the service perspective, such as all instances of a service, a specific instance, an interface, etc.
- Metrics:
- Response time: mainly the latency consumed to respond to a request. For example, the average response time of HTTP requests to an interface is 100 ms.
- Request volume: refers to the system’s capacity and throughput capability, for example, how many requests are processed per second (QPS).
- Error rate: mainly used to monitor the proportion of errors, for example, the proportion of failed calls to an interface over a period of time.
- User layer:
- The user layer mainly refers to monitoring related to users and business, belonging to the functional layer.
3.2. How to Collect Data
3.2.1. What Types of Metrics Data Are There?
- Generally there are several metric types: Gauges, Counters, Histograms, Meters (TPS calculators), and Timers.
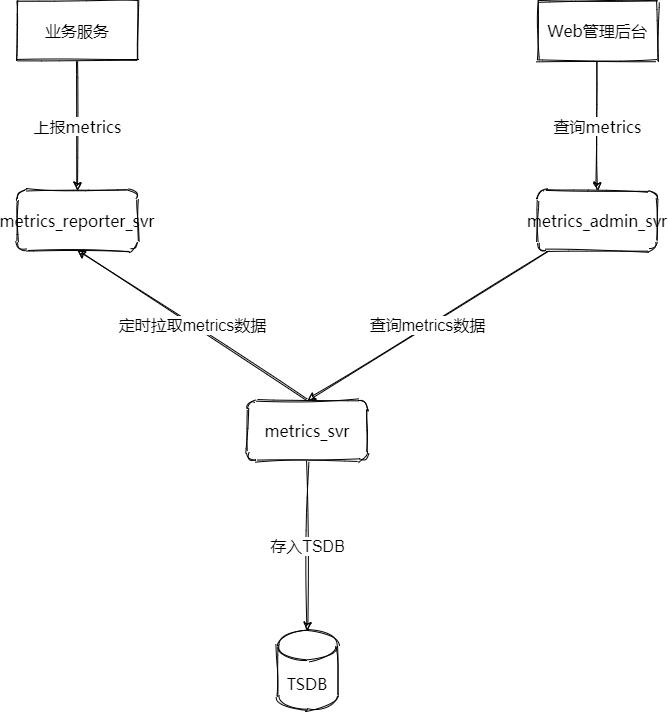
3.2.2. How to Report to the Server
- Push: the target service actively pushes data to the metrics system.
- For example, if an RPC framework supports Filters, write a callee + caller Filter and extract data from the Header of the RPC response.
- Examples include Naver Pinpoint and SkyWalking.
- Pull: the metrics system actively pulls data from the target service.
3.3. Where Is the Data Stored?
3.4. How to Monitor and Alert
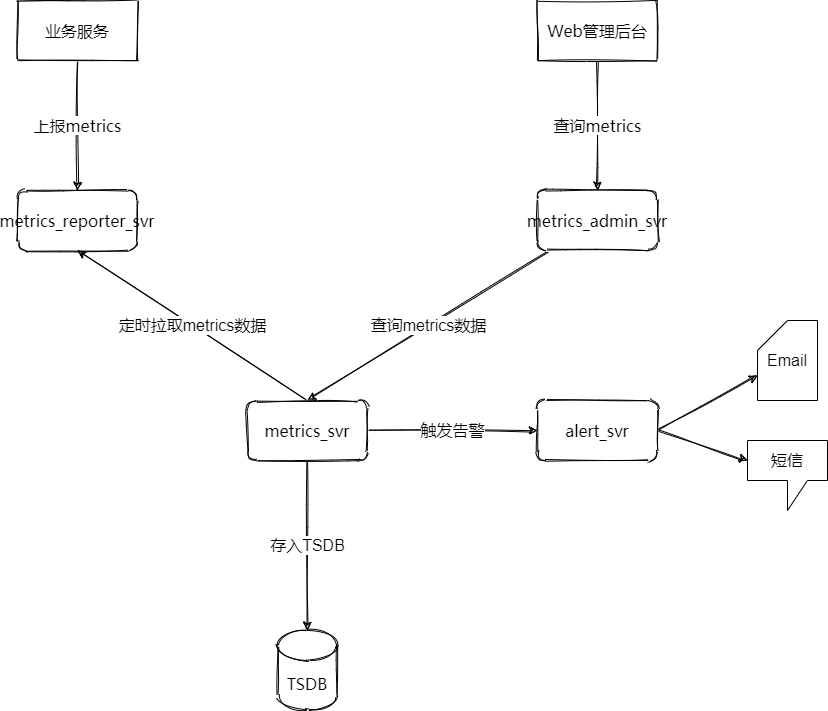
- UI analysis:
- Monitoring and alerting: when storing metrics data, also determine whether an alert rule is triggered.
4. Metrics Monitoring Components
4.1. Prometheus
4.2. InfluxDB
4.3. Open Metrics
- A metrics API standard separated from Prometheus.
Discussion
Sign in with GitHub to comment. Discussions are stored as GitHub Issues.View on GitHub