
NOTE
7.19 OOM Examples
Why OOM occurs and examples for heap, Metaspace, stack overflow, GC overhead, direct buffer memory, and native-thread exhaustion.
This is a historical learning note and may contain outdated or incomplete understanding.
1. Why Does OOM Occur?
Start with the GC reclamation process (see Garbage Collection). GC reclaims objects that are no longer reachable from GC Roots. Objects that remain strongly reachable from GC Roots cannot be reclaimed.
If JVM memory is full of strongly reachable objects, then after a Full GC the remaining JVM memory may be insufficient to store a new object that is about to be created, causing OOM.
1.1. Possible Causes of OOM
1.1.1. Code Problems [50%]
Analyze according to the different memory/resource areas:
- Non-heap resources
- Off-heap memory [direct memory]
- Files
- Sockets
- Database connections
- Method area
- Heap
1.1.2. JVM Parameter Configuration Problems [40%]
1.1.3. Insufficient Machine Memory [10%]
Upgrade the hardware.
2. How to Analyze OOM
2.1. OutOfMemoryError [Heap]
2.1.1. Code
public class OOMTest
{
    // JVM parameters:
    // -Xmx128m -XX:+HeapDumpOnOutOfMemoryError -XX:HeapDumpPath=C:\Users\[user]\Downloads
    public static void main(String[] args)
    {
        Map<Integer, byte[]> map = new HashMap();
        for (int i = 0; i < 128; i++)
        {
            byte[] bytes = new byte[1024 * 1024];//1 MB
            map.put(i, bytes);
        }
    }
}
2.1.2. Obtain a Memory Dump File
- Add JVM parameters
-XX:+HeapDumpOnOutOfMemoryError -XX:HeapDumpPath=./- Use
jmap
jps -l // Obtain PID.
jmap -dump:format=b,file=OOMTest.hprof PID
2.1.3. Analyze with MAT / JProfiler
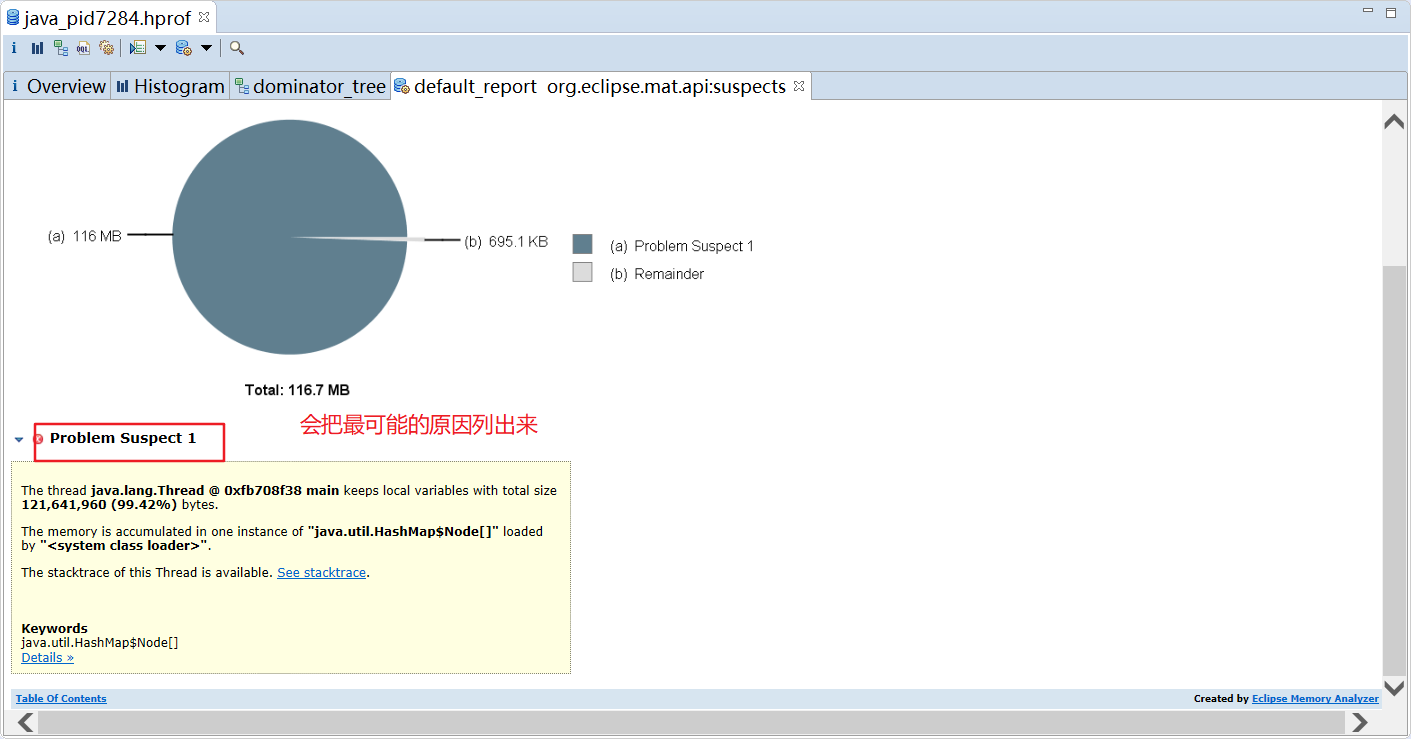
2.1.3.1. MAT: Find the Objects Occupying the Most Space
- Overall functions
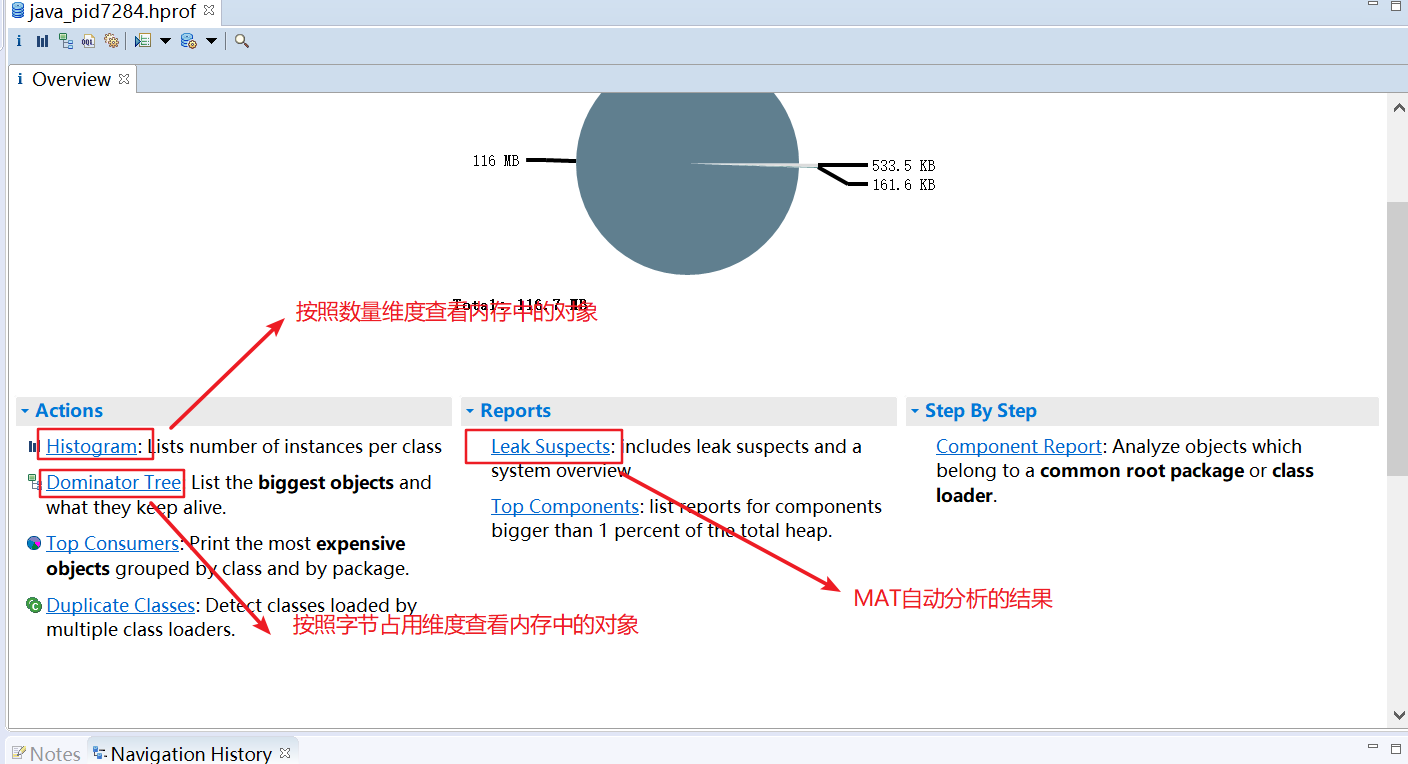
- View by object count
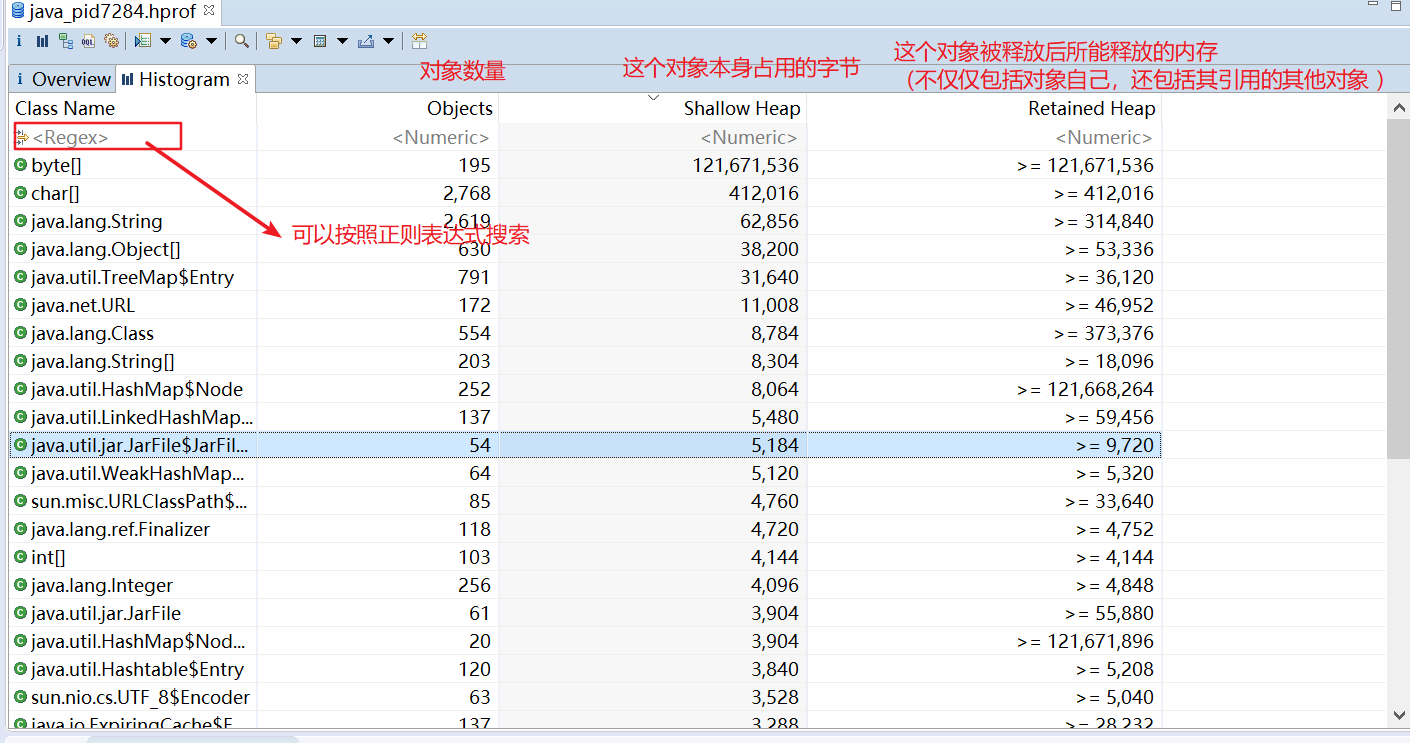
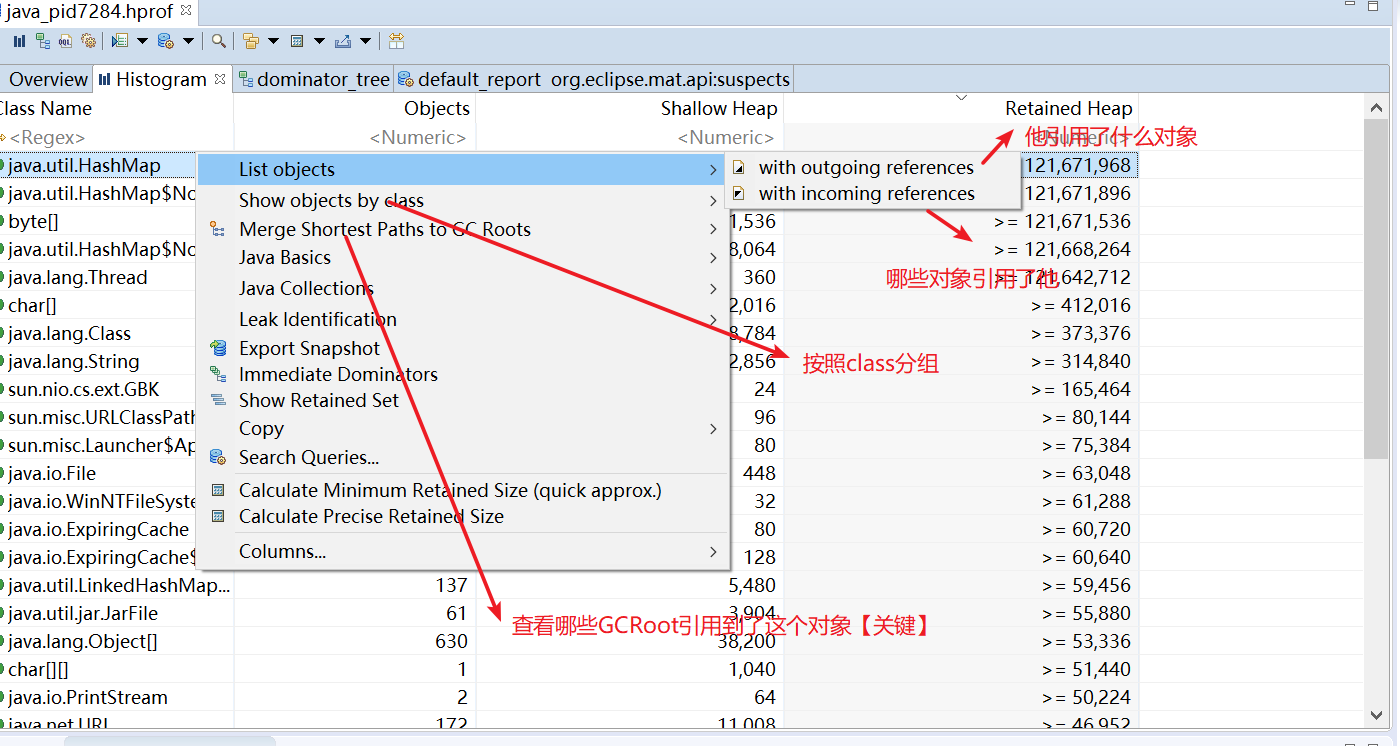
- View by object memory usage
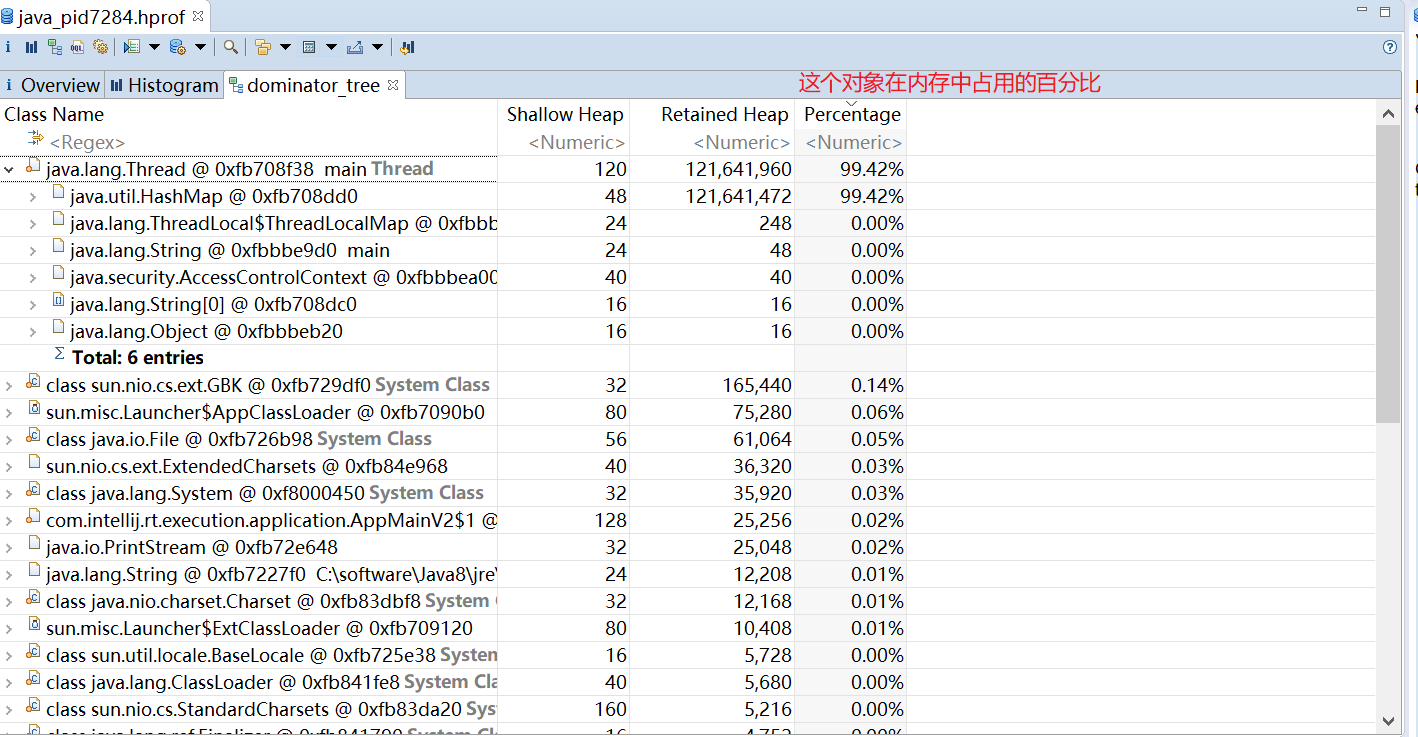
- MAT automatic analysis
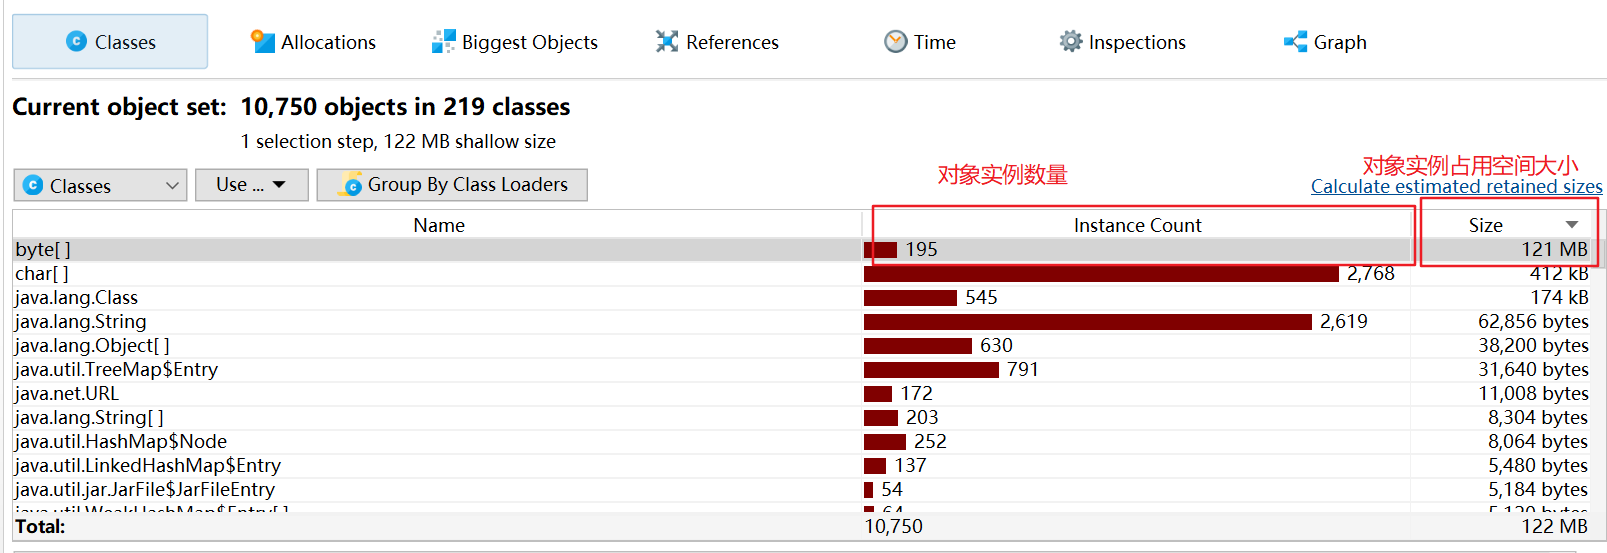
2.1.3.2. JProfiler: Find the Objects Occupying the Most Space
- Sort by bytes occupied
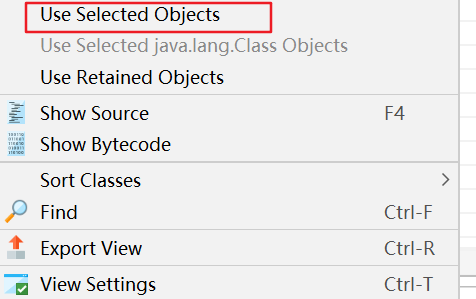
- Analyze the largest object
- See which objects reference this object
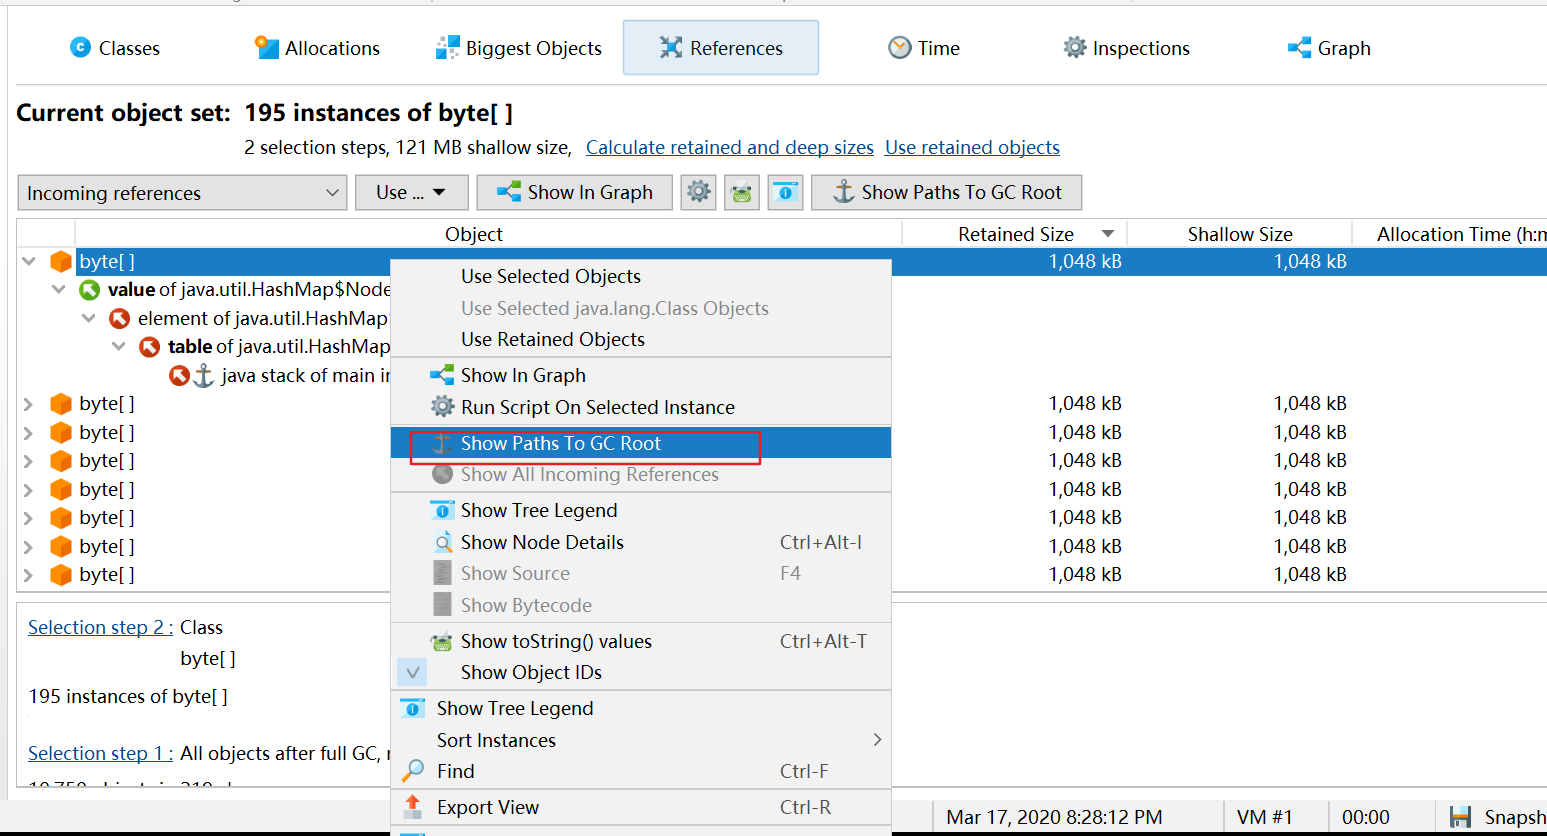
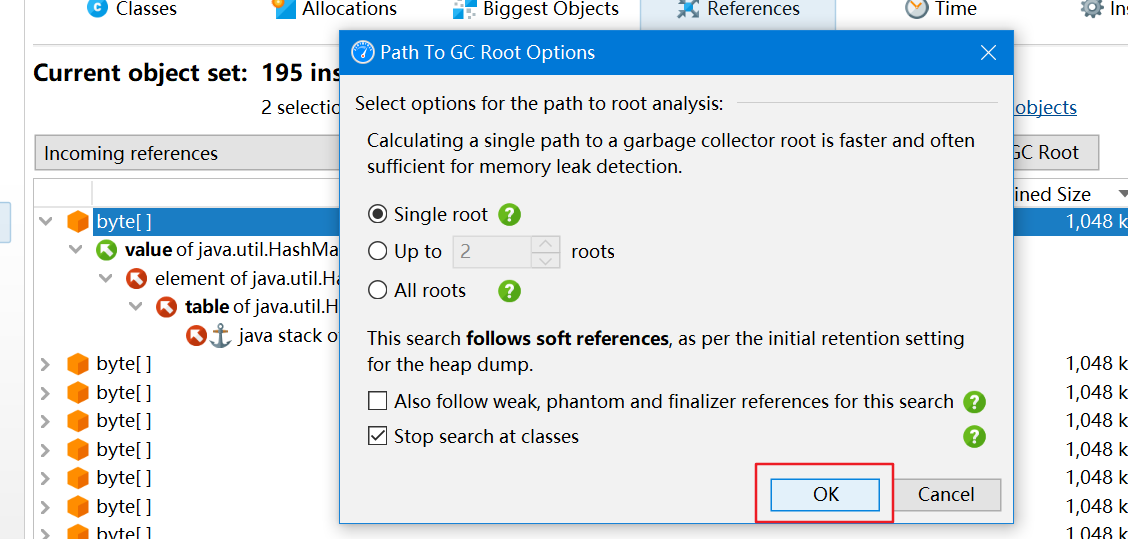
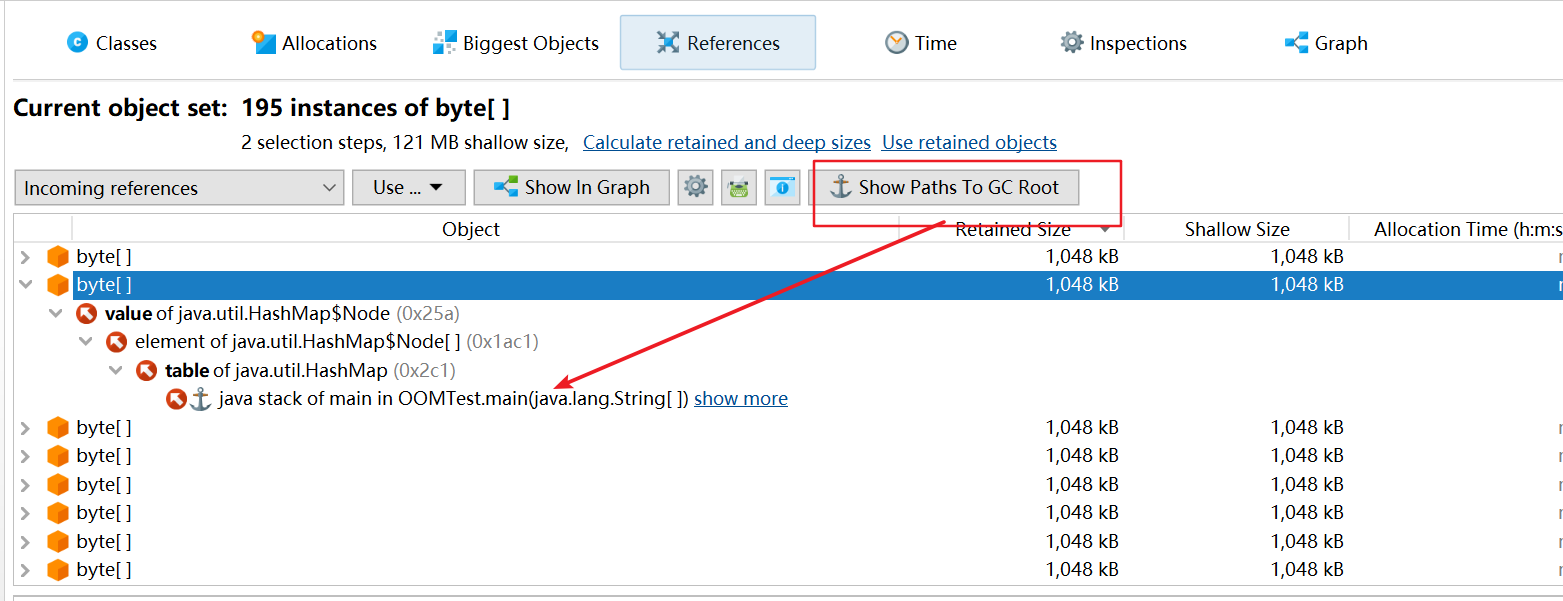
- Find the GC Root
2.2. Metaspace [Method Area]
2.2.1. Code
// JVM parameters:
// -XX:MetaspaceSize=20m -XX:MaxMetaspaceSize=20m -XX:+PrintGCDetails
// -XX:+PrintGCDateStamps -XX:+HeapDumpOnOutOfMemoryError
// -XX:HeapDumpPath=C:\Users\[user]\Downloads
public class OOMMetaspace
{
    static class OOMTest
    {
    }

    public static void metaOOM()
    {
        while (true)
        {
            Enhancer enhancer = new Enhancer();
            enhancer.setSuperclass(OOMTest.class);
            enhancer.setUseCache(false);
            enhancer.setCallback(new MethodInterceptor()
            {
                @Override
                public Object intercept(Object o, Method method, Object[] objects, MethodProxy methodProxy) throws Throwable
                {
                    return methodProxy.invokeSuper(o, null);
                }
            });
            enhancer.create();
        }
    }

    public static void main(String[] args)
    {
        metaOOM();
    }
}
2.2.2. Obtain a Memory Dump File
- Add JVM parameters
-XX:+HeapDumpOnOutOfMemoryError -XX:HeapDumpPath=./- Use
jmap
jps -l // Obtain PID.
jmap -dump:format=b,file=OOMTest.hprof PID
2.2.3. Analyze with MAT / JProfiler
2.2.3.1. MAT
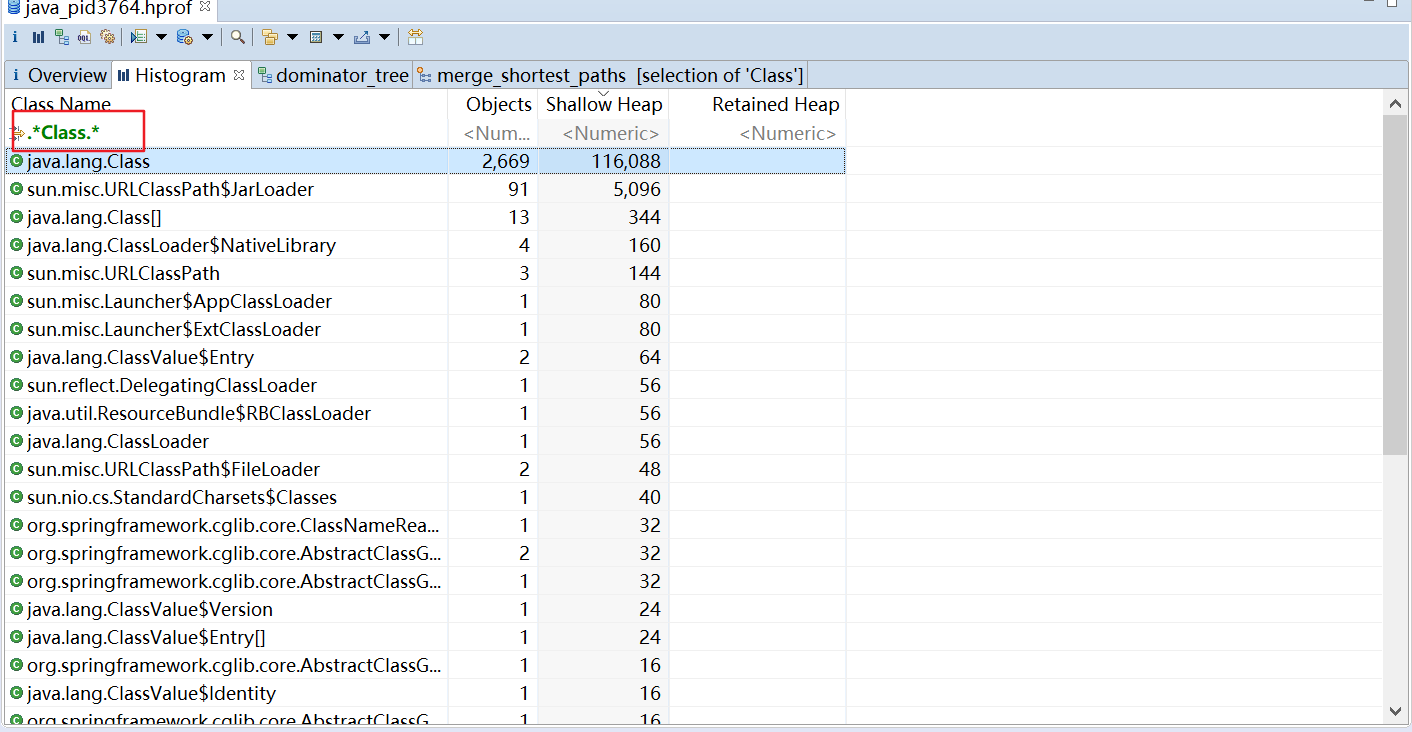
- Search for Class
- View what references Class
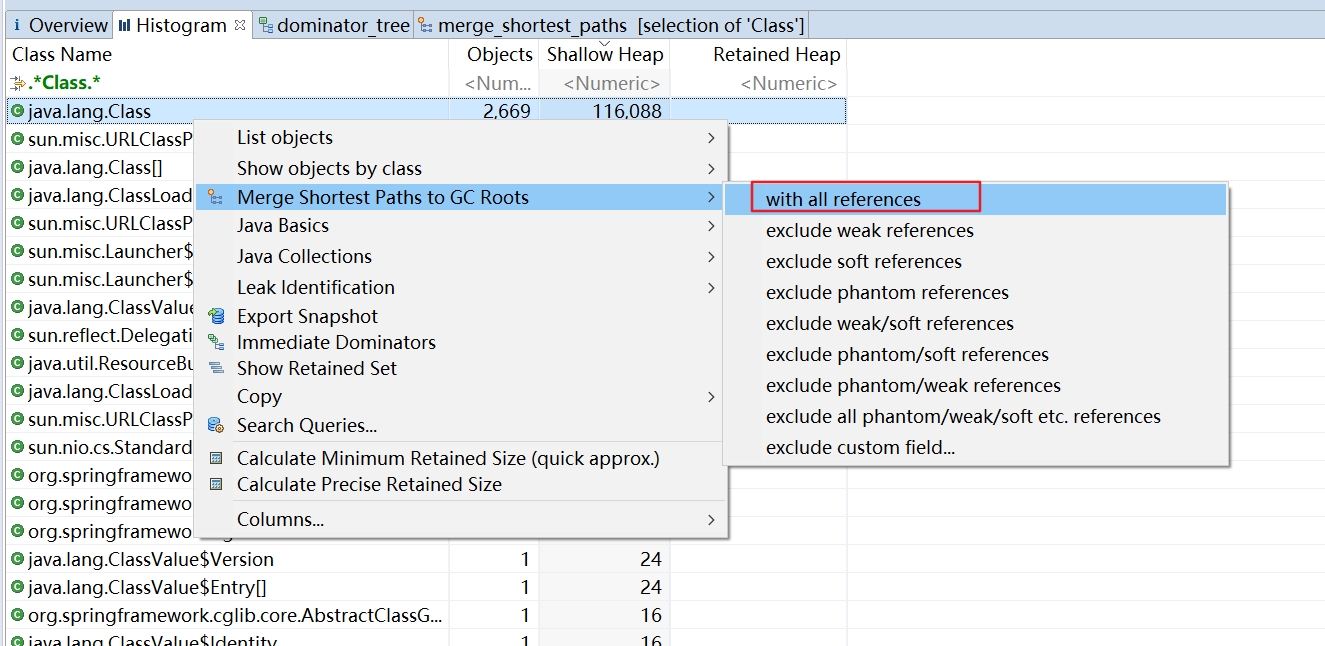
- Find the largest number of references
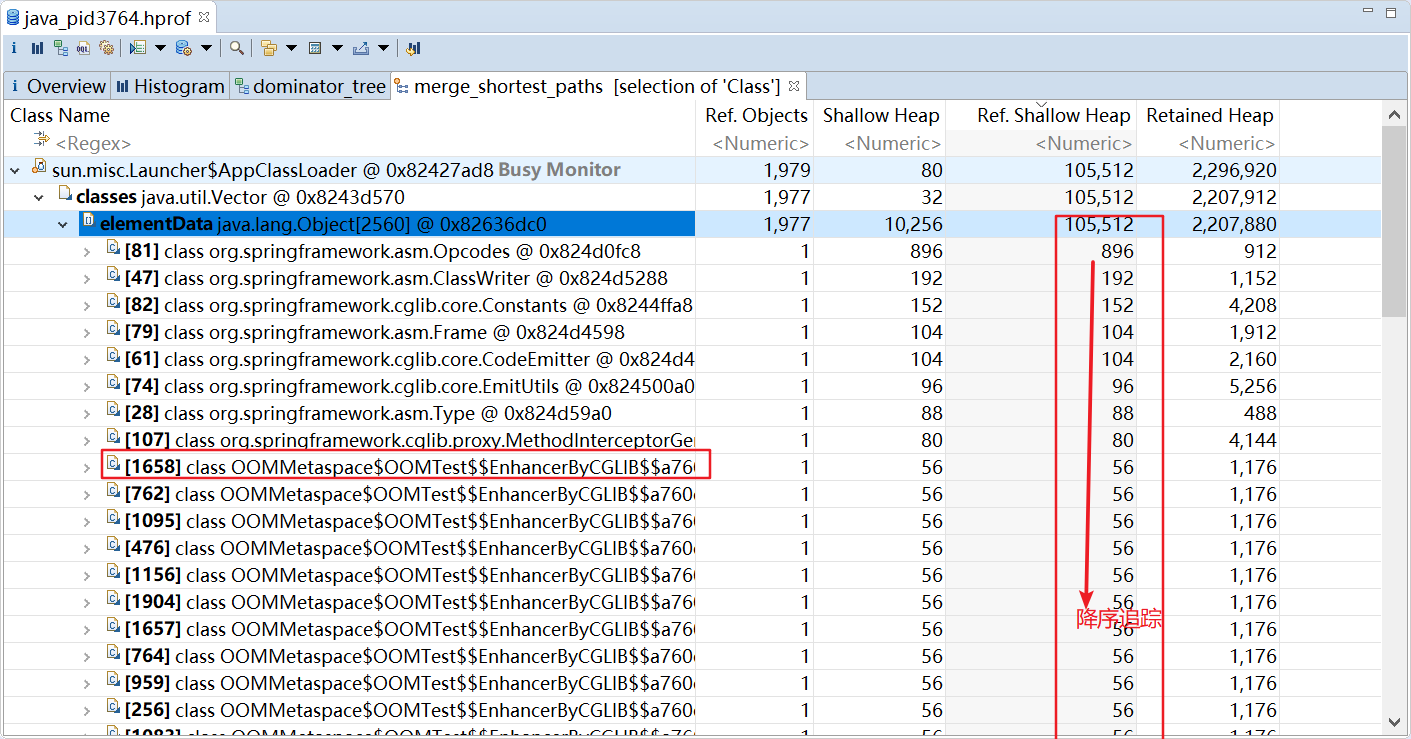
2.2.3.2. JProfiler
- Group by ClassLoader
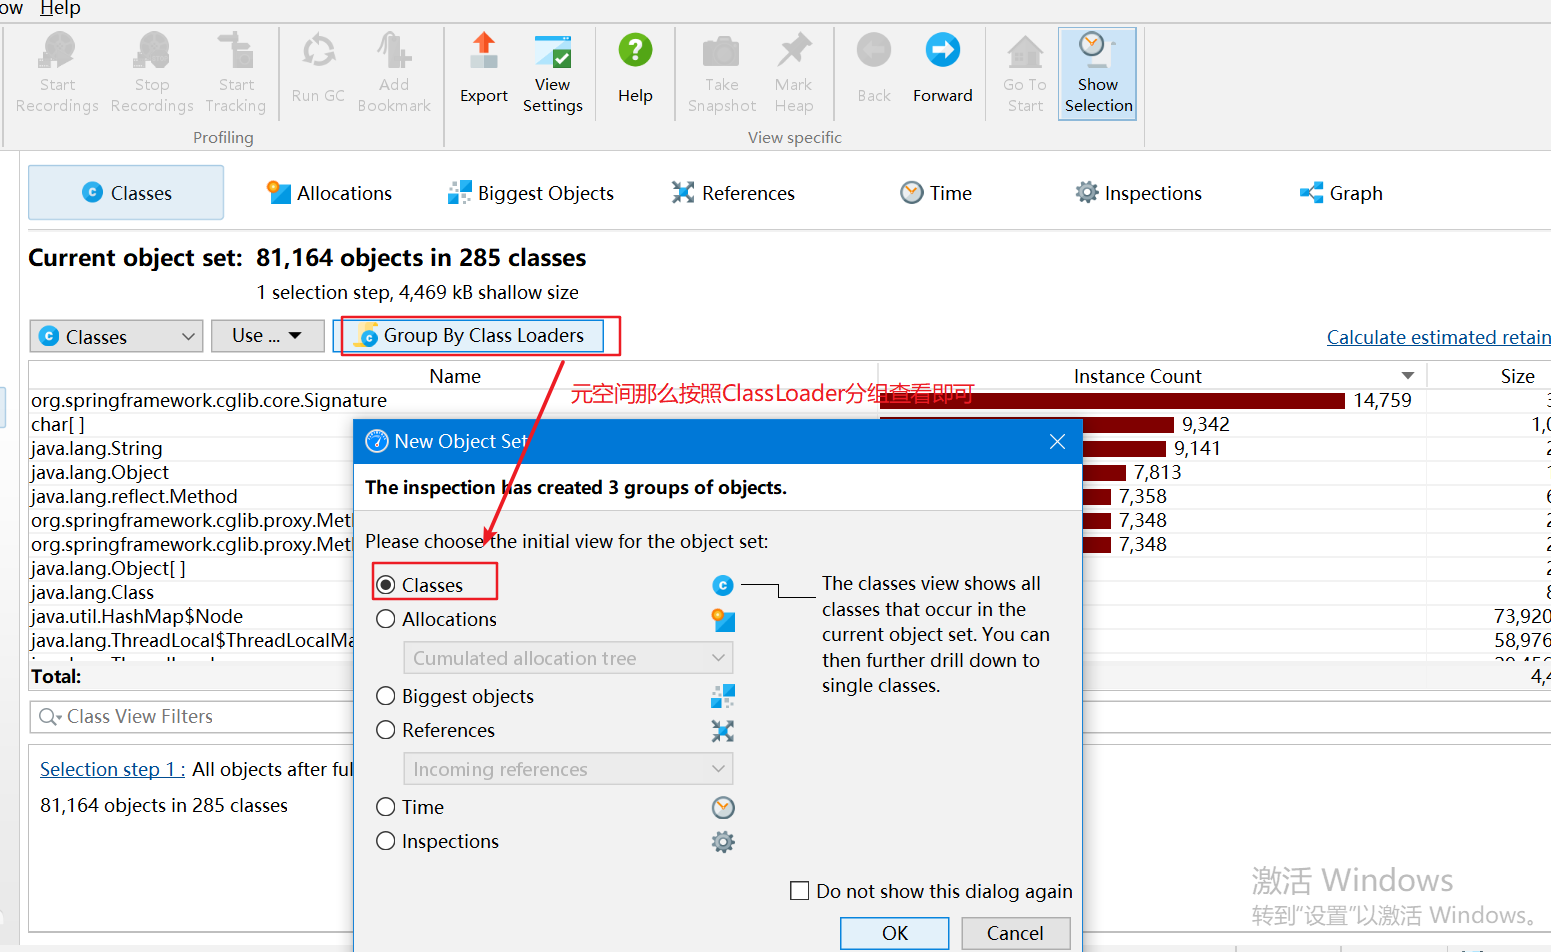
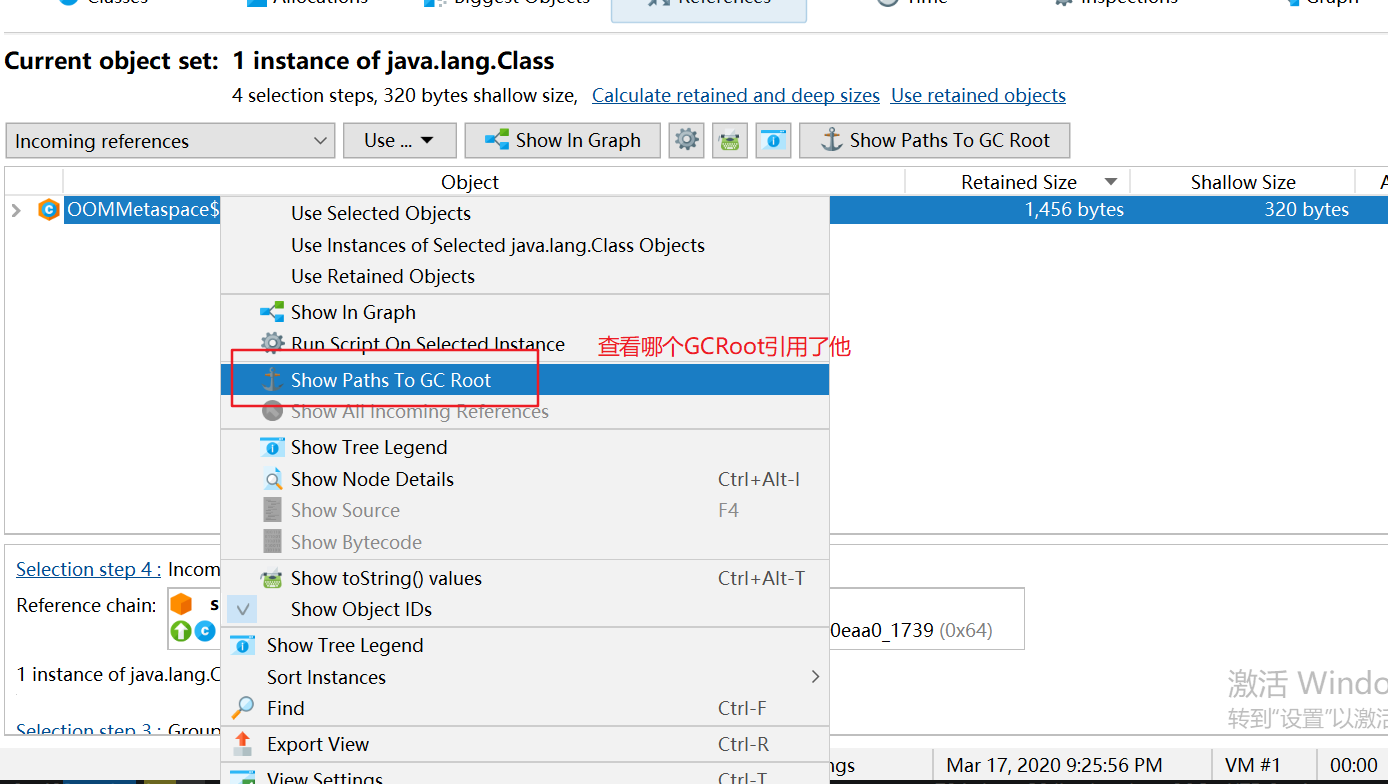
- See who references Class
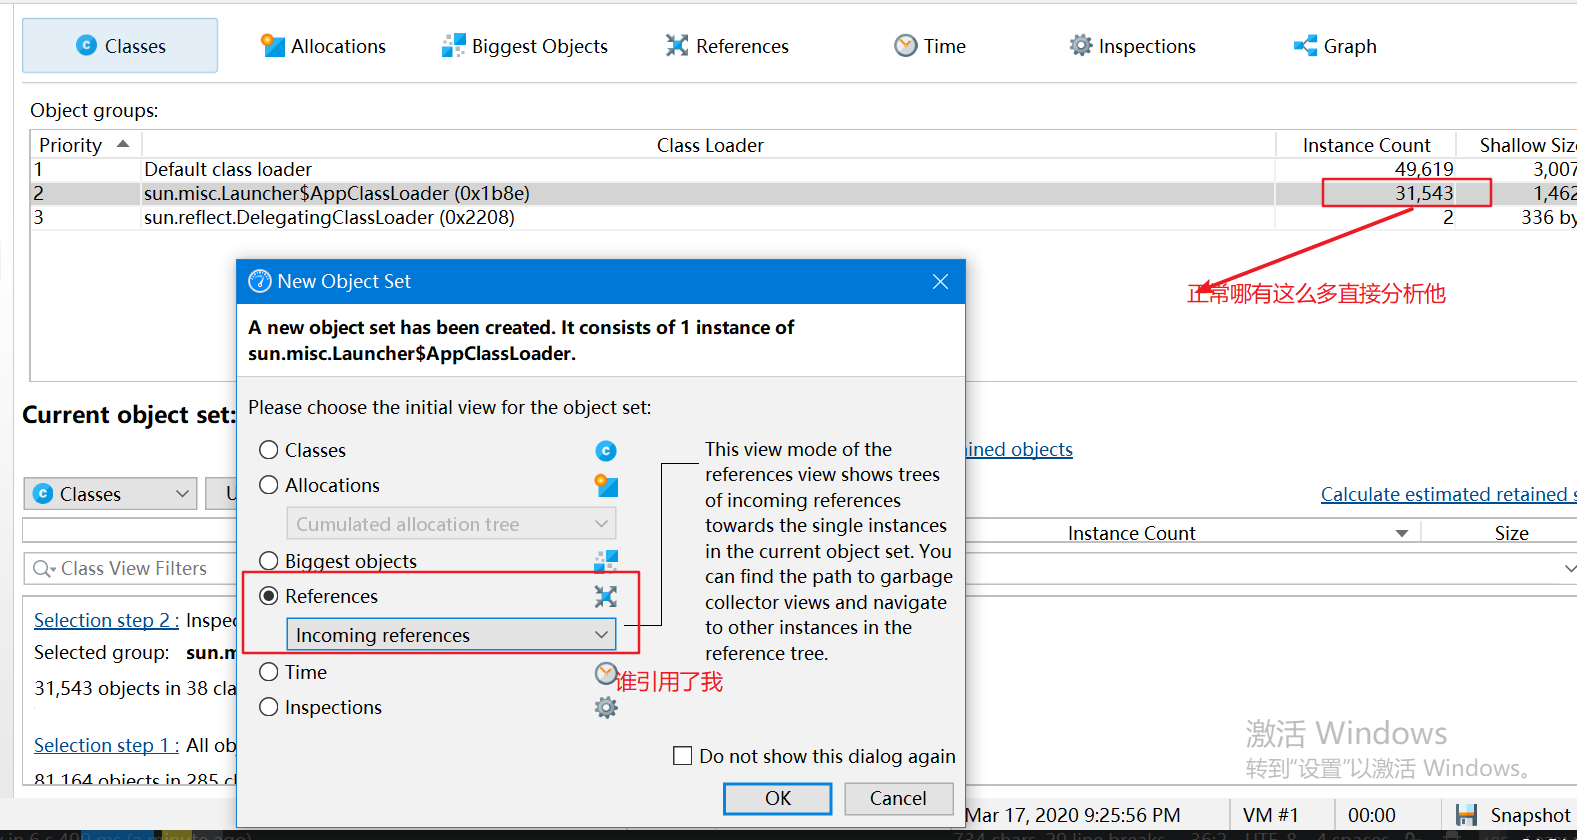
- Analyze one of them
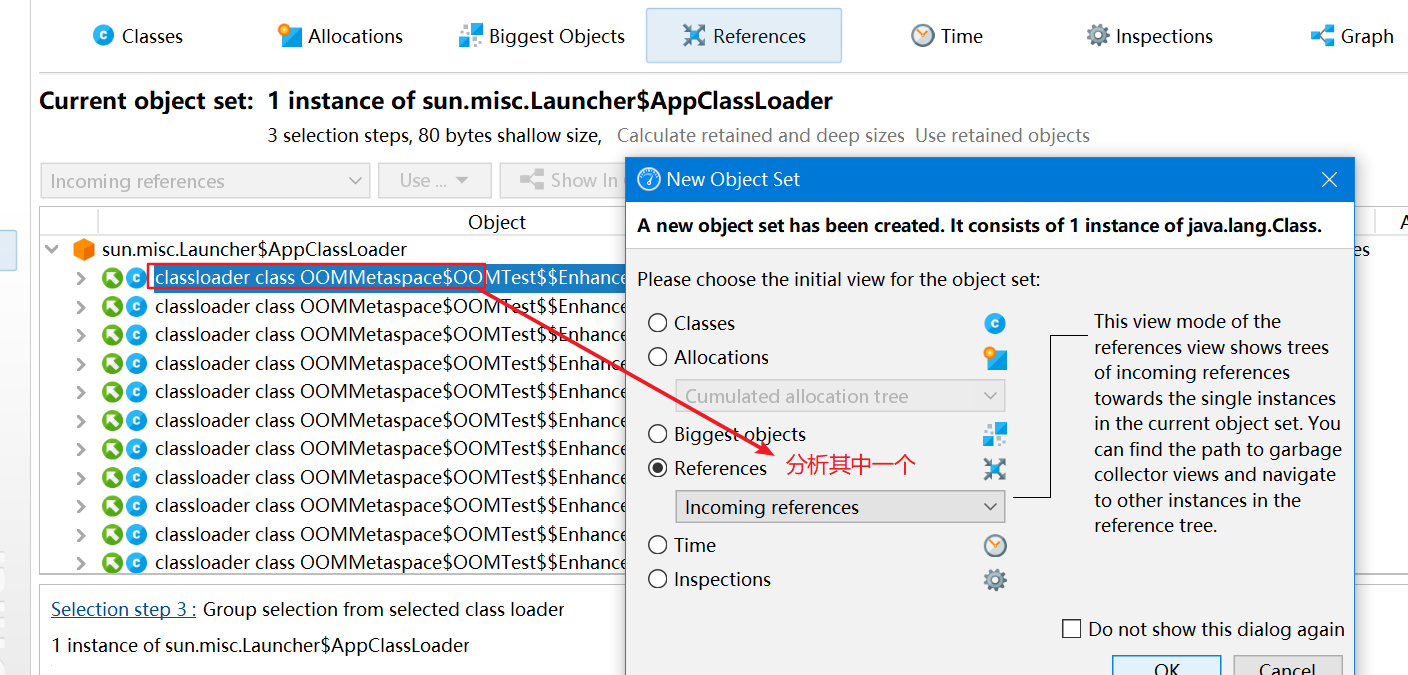
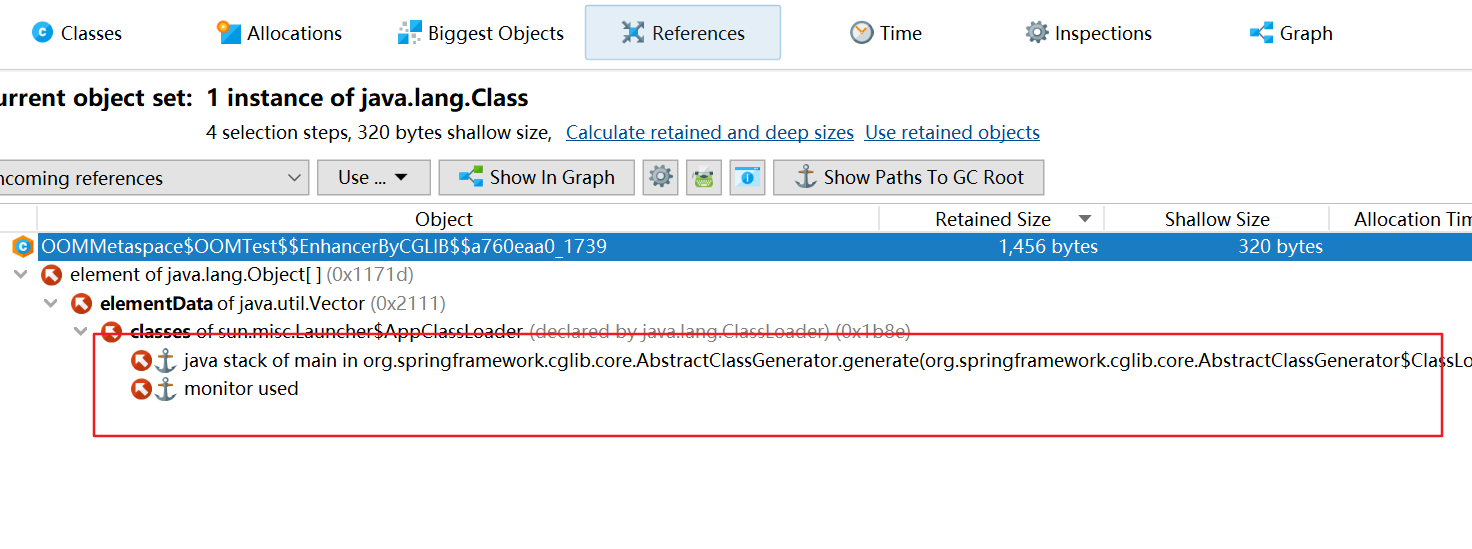
- See which GC Root references it
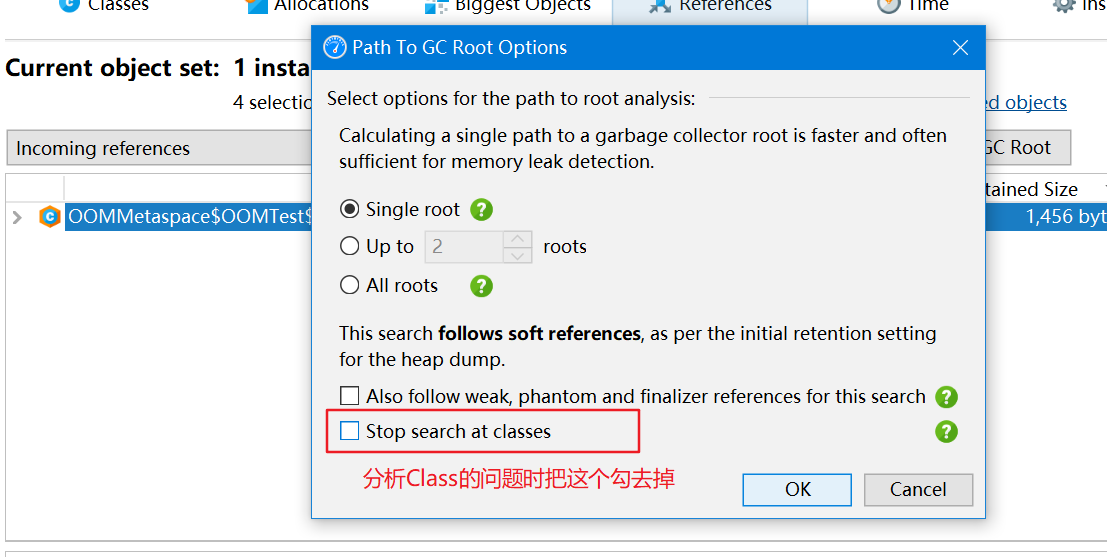
- After finding the GC Root, analyze the code
2.3. Off-Heap Memory
Investigation Process for an Off-Heap Memory Leak - Alibaba Cloud
3. Other OOM Examples
3.1. StackOverflowError [Stack]
Recursion does not have the correct termination condition.
public class OOMStackOverFlow
{
    public static void stackOverflowError()
    {
        stackOverflowError();
    }

    public static void main(String[] args)
    {
        stackOverflowError();
    }
}
3.2. GC overhead limit exceeded [Too Many GCs with Low Efficiency]
The allocated memory is insufficient: a large amount of time is spent on GC, but little memory is reclaimed. The historical rule described in this note is that this error can be thrown when more than 98% of the time is spent doing GC and less than 2% of heap memory is reclaimed.
//-Xms10m -Xmx10m -XX:MaxDirectMemorySize=5m -XX:+PrintGCDetails -XX:+PrintGCDateStamps
public class OOMGCOverHeadLimit
{
    public static void gcOverhead()
    {
        int i = 0;
        List<String> list = new ArrayList<>();

        try
        {
            while (true)
            {
                list.add(String.valueOf(i++).intern());
            }
        }catch (Throwable e)
        {
            e.printStackTrace();
        }
    }

    public static void main(String[] args)
    {
        gcOverhead();
    }
}
3.3. Direct buffer memory [Direct Memory]
//-Xms10m -Xmx10m -XX:+PrintGCDetails -XX:MaxDirectMemorySize=5m -XX:+PrintGCDateStamps
public class OOMDirectBuffer
{
    public static void directBuffer()
    {
        ByteBuffer byteBuffer = ByteBuffer.allocateDirect(1024 * 1024 * 100);
    }

    public static void main(String[] args)
    {
        directBuffer();
    }
}
3.4. unable to create new native thread [Threads]
public class OOMThreadTooMuch
{
    public static void thredTooMuch()
    {
        while (true)
        {
            new Thread(()->{
                try
                {
                    TimeUnit.SECONDS.sleep(Integer.MAX_VALUE);
                }
                catch (InterruptedException e)
                {
                    e.printStackTrace();
                }
            }).start();
        }
    }

    public static void main(String[] args)
    {
        thredTooMuch();
    }
}
Discussion
Sign in with GitHub to comment. Discussions are stored as GitHub Issues.View on GitHub