
NOTE
7.6 Tuning Approach
Goals of tuning, overall production steps, JMeter load-test tuning, and CMS tuning flow.
This is a historical learning note and may contain outdated or incomplete understanding.
1. Purpose of Tuning
Reduce the number of Full GCs / reduce Full GC duration / reduce memory usage.
So-called JVM optimization means allocating and reclaiming objects in the young generation as much as possible, avoiding too many objects frequently entering the old generation and frequent garbage collection of the old generation, while giving the system enough memory so that the young generation does not need to perform garbage collection too frequently.
2. Overall Steps in Production
2.1. Observe the Application’s GC Situation
2.1.1. Add JVM Parameters to Print GC Logs
-XX:+PrintGCDateStamps -XX:+PrintGCDetails -Xloggc:gctest.log2.1.2. Analyze GC Logs
-
If the following phenomena occur, optimization is needed:
- The duration of each garbage collection becomes longer and longer, from about 10 ms before to about 50 ms, while Full GC time also increases from 0.5 s to 4 or 5 s.
- The number of Full GCs keeps increasing, and at the most frequent point one Full GC occurs less than one minute after the previous one.
- Old-generation memory keeps increasing, and no old-generation memory is released after each Full GC.
-
If the following phenomena occur, optimization is not needed:
- Minor GC execution time is less than 50 ms.
- Minor GC is not frequent, about once every 10 seconds.
- Full GC execution time is less than 1 s.
- Full GC is not frequent, no more often than once every 10 minutes.
2.2. If It Is a Memory Leak: Print and Analyze the Dump File
Reference: How to Troubleshoot Online Problems - 1. Memory Usage 100% / Memory Problems (original link is no longer valid).
2.3. If the JVM Parameters Are Unreasonable: Adjust the JVM Parameters
Reference: JVM Parameter Tuning
3. JMeter-Based Load-Test Tuning
3.1. Calculate the QPS per Machine
Assume there are 60 million requests during peak hours, spread over 3 hours, handled by two machines. Then each machine needs to handle 6000/2/3/60/60 = 280 requests per second.
Each request creates objects totaling about 500 bytes, so the memory occupied by objects generated each second is 280*500 = 136 KB.
Expand this by 10-20 times to represent requests from the whole system, occupying about 2.7 MB.
Assume the machine has 4 GB of memory and 2 GB is allocated to the JVM. The young generation is about 700 MB, and Eden + From occupies about 630 MB. This means GC will be triggered after 630/2.7 = 233 s = 3 minutes.
3.2. Use JMeter for Load Testing
Simulate 280 requests per second.
3.3. Observe the GC Situation
- Use
jpsto view the process. - Use
jstatto view GC status in real time.
3.4. Tune as Needed
- If Full GC occurs too many times or too frequently, tune JVM parameters. See: JVM Parameter Tuning.
- If memory usage keeps rising rather than forming a zigzag pattern, this indicates a memory leak. Print a memory Dump and analyze it. Reference: How to Troubleshoot Online Problems - 1. Memory Usage 100% / Memory Problems (original link is no longer valid).
- Optimize according to the situation: architecture -> code -> database -> JVM -> operating system. Reference: How to Optimize a Project.md (original link is no longer valid).
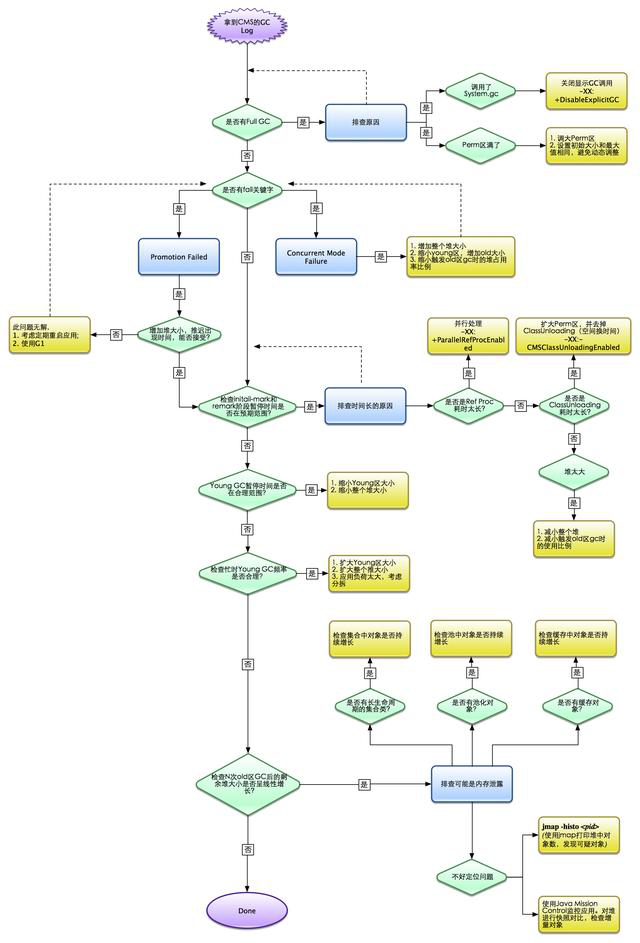
4. CMS Tuning Flowchart
Discussion
Sign in with GitHub to comment. Discussions are stored as GitHub Issues.View on GitHub